
Landlord's Agent in 2020
Debbie Brand
Keller Williams Realty-Metropolitan
(603) 261-7389
31 Total Sales

Estimated Value: $348,000 - $371,000
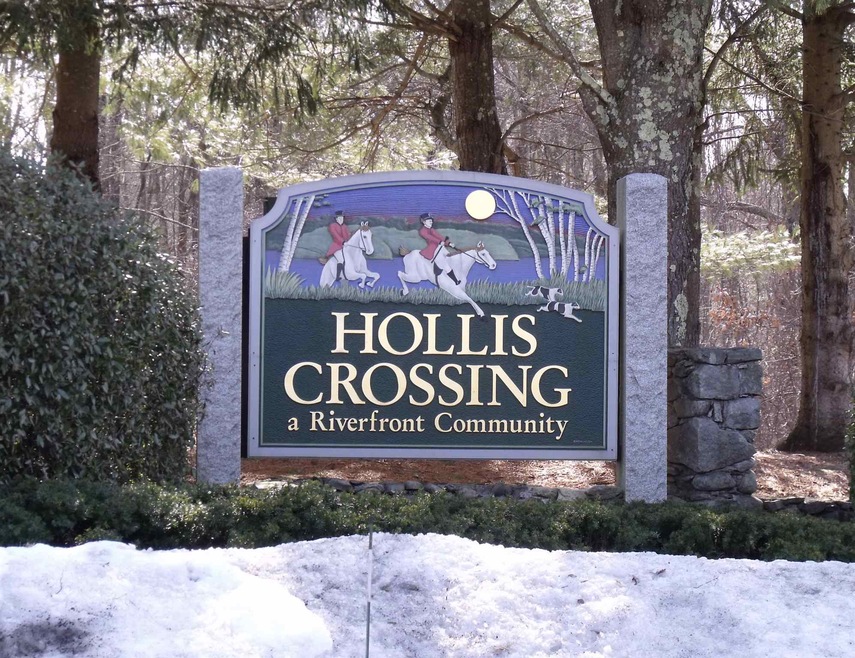
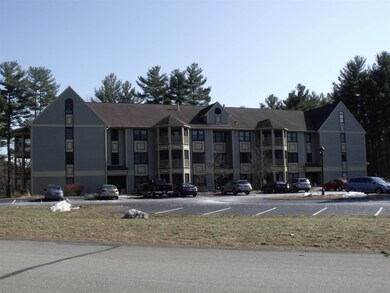
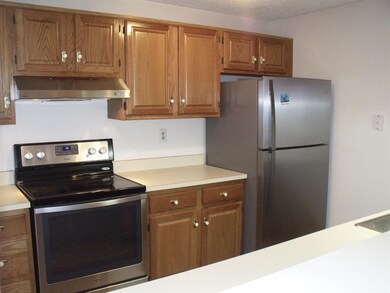
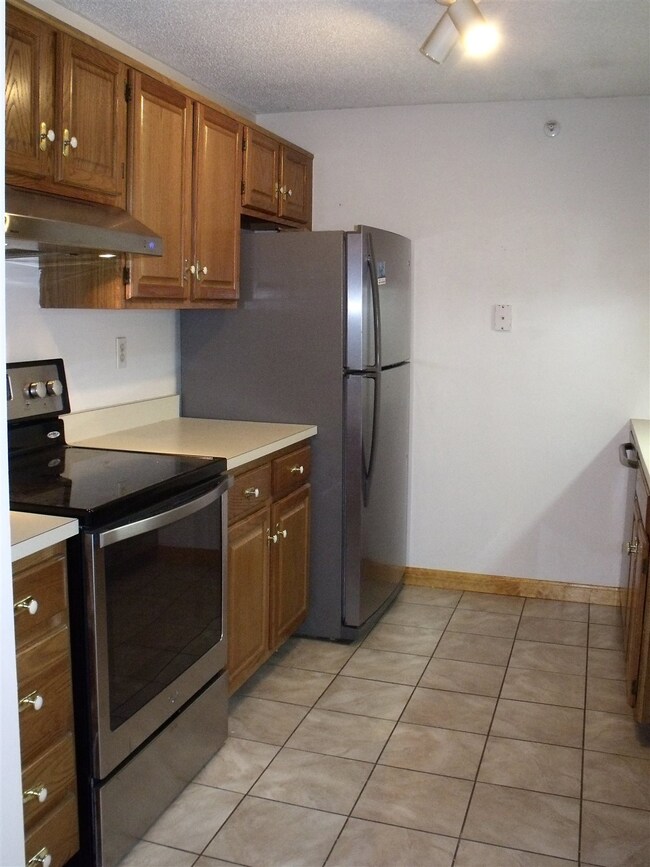
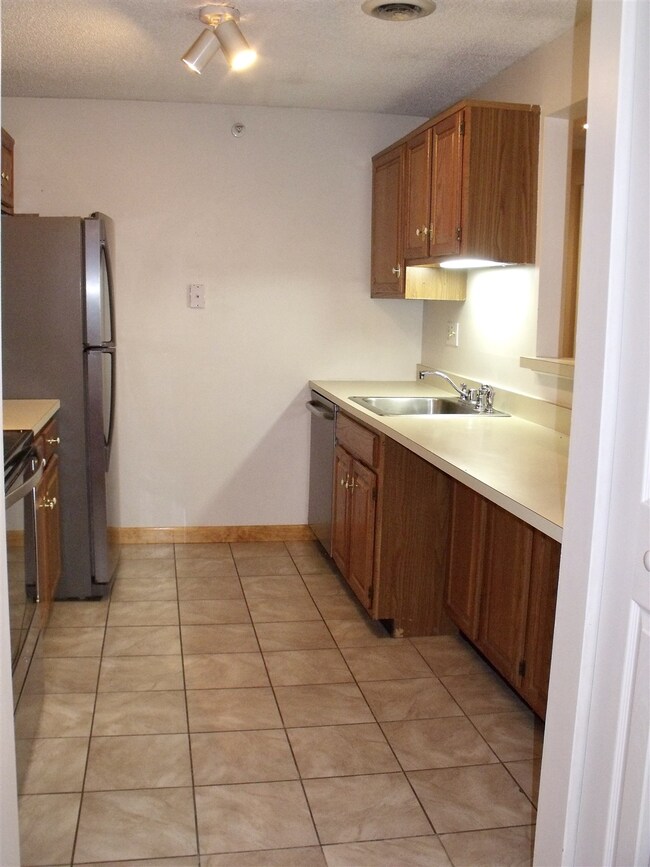
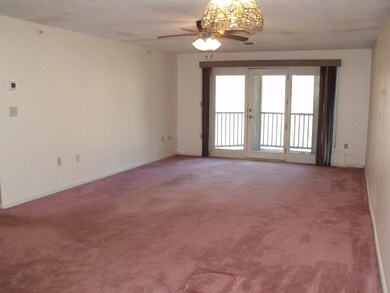
HOLLIS CROSSING CONDOMINIUMS - 2 bedroom, 2 bath corner unit on third floor. Open concept main living area with covered/screened porch off living room. Master bedroom w/ bath and his and hers closets. Secure storage area in attic, central air and washer/dryer in unit. Amenities include an elevator, 2 pools, basketball and tennis courts, baseball field and walking/biking trails along the Nashua River. Close to highways, shopping and restaurants. NO PETS. NO SMOKING. Credit check and one year lease required. Tenants pay utilities.
Last Agent to Rent the Property
Keller Williams Realty-Metropolitan License #068418 Listed on: 03/03/2020
Last Renter's Agent
Keller Williams Realty-Metropolitan License #068418 Listed on: 03/03/2020
| Date | Buyer | Sale Price | Title Company |
|---|---|---|---|
| Difonte Investments Llc | -- | None Available | |
| Difonte Jeffrey P | $133,000 | -- |
| Date | Status | Borrower | Loan Amount |
|---|---|---|---|
| Previous Owner | Difonte Jeffrey P | $106,400 |
| Date | Event | Price | List to Sale | Price per Sq Ft |
|---|---|---|---|---|
| 03/21/2020 03/21/20 | Rented | $1,500 | 0.0% | -- |
| 03/03/2020 03/03/20 | For Rent | $1,500 | 0.0% | -- |
| 07/31/2019 07/31/19 | Rented | $1,500 | 0.0% | -- |
| 07/01/2019 07/01/19 | For Rent | $1,500 | +18.6% | -- |
| 10/26/2013 10/26/13 | Rented | $1,265 | 0.0% | -- |
| 10/26/2013 10/26/13 | For Rent | $1,265 | -- | -- |
| Year | Tax Paid | Tax Assessment Tax Assessment Total Assessment is a certain percentage of the fair market value that is determined by local assessors to be the total taxable value of land and additions on the property. | Land | Improvement |
|---|---|---|---|---|
| 2024 | $4,956 | $311,700 | $0 | $311,700 |
| 2023 | $4,683 | $256,900 | $0 | $256,900 |
| 2022 | $4,642 | $256,900 | $0 | $256,900 |
| 2021 | $3,785 | $163,000 | $0 | $163,000 |
| 2020 | $3,685 | $163,000 | $0 | $163,000 |
| 2019 | $3,547 | $163,000 | $0 | $163,000 |
| 2018 | $3,457 | $163,000 | $0 | $163,000 |
| 2017 | $3,103 | $120,300 | $0 | $120,300 |
| 2016 | $3,016 | $120,300 | $0 | $120,300 |
| 2015 | $2,951 | $120,300 | $0 | $120,300 |
| 2014 | $2,893 | $120,300 | $0 | $120,300 |
Landlord's Agent in 2020
Debbie Brand
Keller Williams Realty-Metropolitan
(603) 261-7389
31 Total Sales
Buyer's Agent in 2013
Meg McPhee
Keller Williams Realty-Metropolitan
(603) 957-8656
17 Total Sales
Source: PrimeMLS
MLS Number: 4796192
APN: NASH-000000-000004-000308-000011F
Disclaimer: Certain information contained herein is derived from information provided by parties other than Homes.com. All information provided is deemed reliable, but is not guaranteed to be accurate and should be independently verified.
![]() Copyright 2025 PrimeMLS, Inc. All rights reserved. This information is deemed reliable, but not guaranteed. The data relating to real estate displayed on this display comes in part from the IDX Program of PrimeMLS. The information being provided is for consumers’ personal, non-commercial use and may not be used for any purpose other than to identify prospective properties consumers may be interested in purchasing.
Copyright 2025 PrimeMLS, Inc. All rights reserved. This information is deemed reliable, but not guaranteed. The data relating to real estate displayed on this display comes in part from the IDX Program of PrimeMLS. The information being provided is for consumers’ personal, non-commercial use and may not be used for any purpose other than to identify prospective properties consumers may be interested in purchasing.