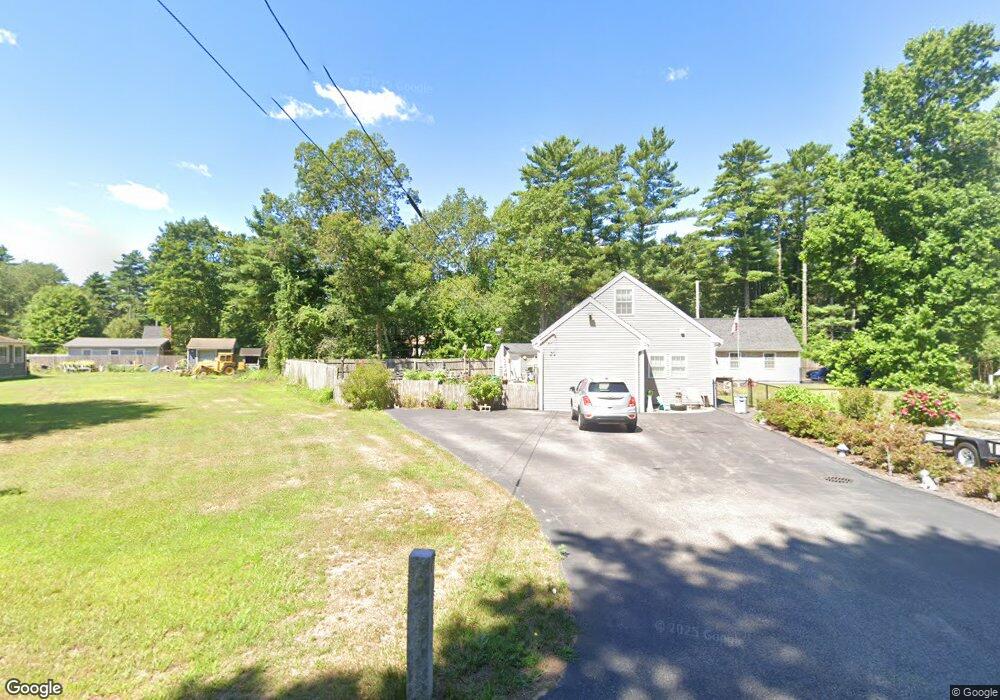
11 Bates Pond Rd Carver, MA 02330
Estimated Value: $471,000 - $548,000
3
Beds
1
Bath
1,373
Sq Ft
$367/Sq Ft
Est. Value
About This Home
This home is located at 11 Bates Pond Rd, Carver, MA 02330 and is currently estimated at $504,542, approximately $367 per square foot. 11 Bates Pond Rd is a home located in Plymouth County with nearby schools including Carver Elementary School and Carver Middle/High School.
Ownership History
Date
Name
Owned For
Owner Type
Purchase Details
Closed on
Nov 1, 2005
Sold by
Correia Anne
Bought by
Sagesta Christopher J and Cobb Lisa M
Current Estimated Value
Purchase Details
Closed on
Apr 12, 2005
Sold by
Gonski Mitchell E and Gonski Deborah A
Bought by
Correia Anne
Purchase Details
Closed on
Jan 31, 1997
Sold by
Fisher Damon G and Fisher Cheryle A
Bought by
Gonski Mitchell E and Gonski Mitchell E
Create a Home Valuation Report for This Property
The Home Valuation Report is an in-depth analysis detailing your home's value as well as a comparison with similar homes in the area
Home Values in the Area
Average Home Value in this Area
Purchase History
| Date | Buyer | Sale Price | Title Company |
|---|---|---|---|
| Sagesta Christopher J | $300,000 | -- | |
| Correia Anne | $224,000 | -- | |
| Gonski Mitchell E | $94,000 | -- |
Source: Public Records
Mortgage History
| Date | Status | Borrower | Loan Amount |
|---|---|---|---|
| Closed | Gonski Mitchell E | $222,000 | |
| Closed | Gonski Mitchell E | $300,000 |
Source: Public Records
Tax History
| Year | Tax Paid | Tax Assessment Tax Assessment Total Assessment is a certain percentage of the fair market value that is determined by local assessors to be the total taxable value of land and additions on the property. | Land | Improvement |
|---|---|---|---|---|
| 2025 | $5,576 | $402,000 | $128,800 | $273,200 |
| 2024 | $5,207 | $367,500 | $126,300 | $241,200 |
| 2023 | $5,050 | $346,100 | $126,300 | $219,800 |
| 2022 | $4,690 | $293,500 | $102,600 | $190,900 |
| 2021 | $4,533 | $267,600 | $91,600 | $176,000 |
| 2020 | $4,330 | $251,900 | $85,600 | $166,300 |
| 2019 | $4,182 | $245,300 | $83,100 | $162,200 |
| 2018 | $3,998 | $226,800 | $83,100 | $143,700 |
| 2017 | $3,886 | $219,700 | $84,200 | $135,500 |
| 2016 | $3,580 | $210,200 | $80,200 | $130,000 |
| 2015 | $3,523 | $207,100 | $80,200 | $126,900 |
| 2014 | $3,283 | $193,000 | $101,400 | $91,600 |
Source: Public Records
Map
Nearby Homes
Your Personal Tour Guide
Ask me questions while you tour the home.