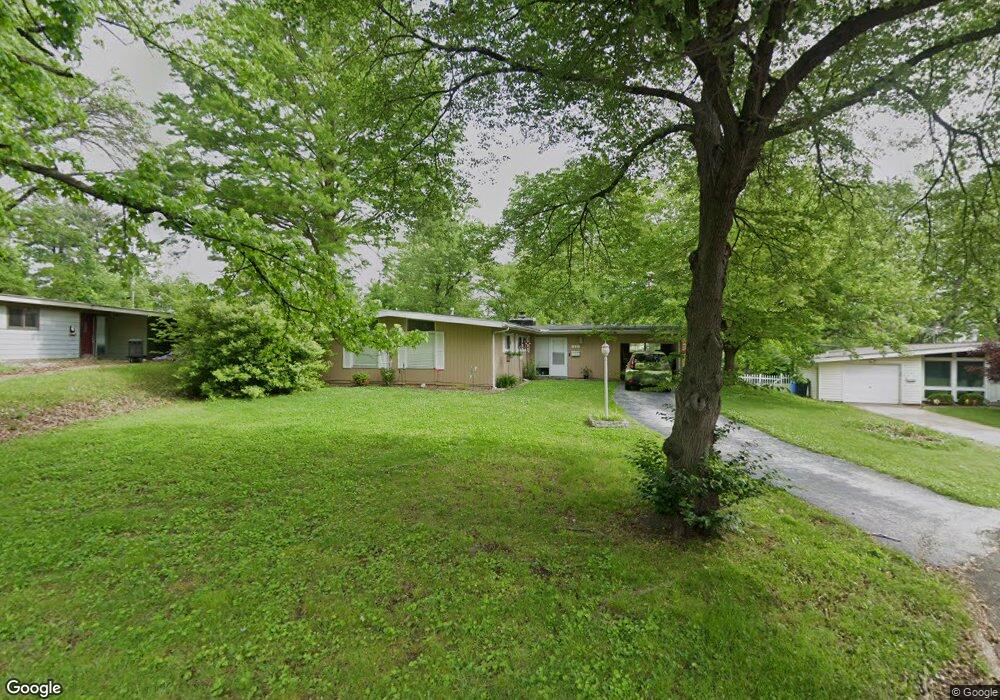
11 Bayberry Ln Florissant, MO 63033
Estimated Value: $163,000 - $182,000
3
Beds
2
Baths
1,473
Sq Ft
$117/Sq Ft
Est. Value
About This Home
This home is located at 11 Bayberry Ln, Florissant, MO 63033 and is currently estimated at $172,820, approximately $117 per square foot. 11 Bayberry Ln is a home located in St. Louis County with nearby schools including Parker Road Elementary School, Cross Keys Middle School, and McCluer North High School.
Ownership History
Date
Name
Owned For
Owner Type
Purchase Details
Closed on
Apr 29, 2011
Sold by
Spinelli Jeffrey S and Spinelli Tammy
Bought by
Realty Quest L L C
Current Estimated Value
Purchase Details
Closed on
Oct 8, 2009
Sold by
Secretary Of Housing & Urban Development
Bought by
Spinelli Jeffrey S and Spinelli Tammy
Purchase Details
Closed on
May 18, 2009
Sold by
Tatum Shane A
Bought by
Secretary Of Housing & Urban Development
Purchase Details
Closed on
May 20, 2005
Sold by
Huber Patricia Anne
Bought by
Tatum Shane Allan
Home Financials for this Owner
Home Financials are based on the most recent Mortgage that was taken out on this home.
Original Mortgage
$104,077
Interest Rate
5.83%
Mortgage Type
FHA
Create a Home Valuation Report for This Property
The Home Valuation Report is an in-depth analysis detailing your home's value as well as a comparison with similar homes in the area
Home Values in the Area
Average Home Value in this Area
Purchase History
| Date | Buyer | Sale Price | Title Company |
|---|---|---|---|
| Realty Quest L L C | -- | None Available | |
| Spinelli Jeffrey S | $46,500 | First American Title Ins Co | |
| Secretary Of Housing & Urban Development | $103,435 | None Available | |
| Tatum Shane Allan | $104,900 | -- |
Source: Public Records
Mortgage History
| Date | Status | Borrower | Loan Amount |
|---|---|---|---|
| Previous Owner | Tatum Shane Allan | $104,077 |
Source: Public Records
Tax History Compared to Growth
Tax History
| Year | Tax Paid | Tax Assessment Tax Assessment Total Assessment is a certain percentage of the fair market value that is determined by local assessors to be the total taxable value of land and additions on the property. | Land | Improvement |
|---|---|---|---|---|
| 2025 | $2,112 | $31,500 | $6,610 | $24,890 |
| 2024 | $2,112 | $27,230 | $4,960 | $22,270 |
| 2023 | $2,105 | $27,230 | $4,960 | $22,270 |
| 2022 | $1,892 | $21,490 | $4,960 | $16,530 |
| 2021 | $1,860 | $21,490 | $4,960 | $16,530 |
| 2020 | $1,557 | $17,500 | $3,820 | $13,680 |
| 2019 | $1,581 | $17,500 | $3,820 | $13,680 |
| 2018 | $1,564 | $15,470 | $2,130 | $13,340 |
| 2017 | $1,556 | $15,470 | $2,130 | $13,340 |
| 2016 | $1,316 | $12,710 | $2,130 | $10,580 |
| 2015 | $1,324 | $12,710 | $2,130 | $10,580 |
| 2014 | $1,405 | $13,950 | $3,880 | $10,070 |
Source: Public Records
Map
Nearby Homes
- 12 Country Ln
- 415 Waterford Dr
- 375 Waterford Dr
- 265 Waterford Dr
- 2320 Allen Dr
- 2340 Saint Catherine St
- 2240 Brook Dr
- 785 Bobbins Ln
- 505 Ridge Dr
- 675 Pimlico Dr
- 805 Derhake Rd
- 750 Robinwood Dr
- 2700 Suffolk Place
- 2425 Johnstown Dr
- 1060 Preakness Ln
- 190 Coteau Ln
- 1965 Saint Catherine St
- 130 Dauphin Ln
- 670 Hargrove Ln
- 2 Carson Ct