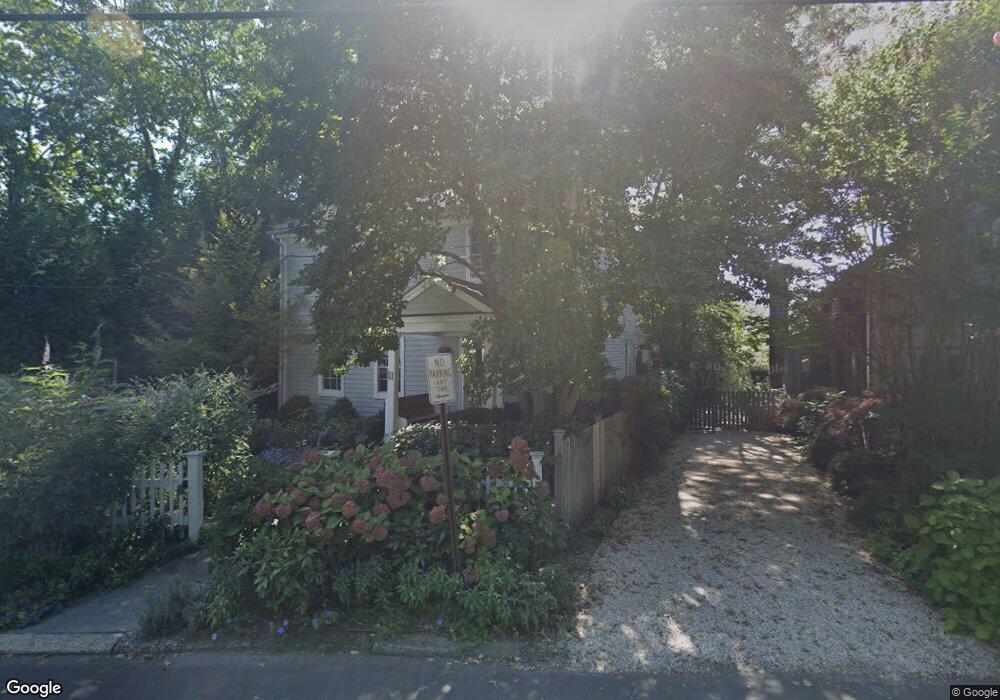
11 Bayview Ave Sag Harbor, NY 11963
Estimated Value: $1,965,000 - $3,578,724
3
Beds
3
Baths
1,889
Sq Ft
$1,578/Sq Ft
Est. Value
About This Home
This home is located at 11 Bayview Ave, Sag Harbor, NY 11963 and is currently estimated at $2,980,181, approximately $1,577 per square foot. 11 Bayview Ave is a home located in Suffolk County with nearby schools including Sag Harbor Elementary School, Pierson Middle/High School, and Ross Lower School.
Ownership History
Date
Name
Owned For
Owner Type
Purchase Details
Closed on
Apr 26, 1999
Sold by
Valtelberg Rurick and Depetris Tamara Telberg
Bought by
Loewenberg Charles R
Current Estimated Value
Home Financials for this Owner
Home Financials are based on the most recent Mortgage that was taken out on this home.
Original Mortgage
$363,300
Outstanding Balance
$120,884
Interest Rate
6.87%
Mortgage Type
Construction
Estimated Equity
$2,859,297
Purchase Details
Closed on
Jul 4, 1998
Sold by
Telberg Lelia
Bought by
Lelia Telberg Irrevocable Trust
Create a Home Valuation Report for This Property
The Home Valuation Report is an in-depth analysis detailing your home's value as well as a comparison with similar homes in the area
Home Values in the Area
Average Home Value in this Area
Purchase History
| Date | Buyer | Sale Price | Title Company |
|---|---|---|---|
| Loewenberg Charles R | $319,000 | -- | |
| Lelia Telberg Irrevocable Trust | -- | Fidelity National Title Ins |
Source: Public Records
Mortgage History
| Date | Status | Borrower | Loan Amount |
|---|---|---|---|
| Open | Loewenberg Charles R | $363,300 |
Source: Public Records
Tax History Compared to Growth
Tax History
| Year | Tax Paid | Tax Assessment Tax Assessment Total Assessment is a certain percentage of the fair market value that is determined by local assessors to be the total taxable value of land and additions on the property. | Land | Improvement |
|---|---|---|---|---|
| 2024 | $4,088 | $1,471,900 | $1,056,300 | $415,600 |
| 2023 | $4,048 | $1,471,900 | $1,056,300 | $415,600 |
| 2022 | $3,997 | $1,471,900 | $1,056,300 | $415,600 |
| 2021 | $3,887 | $1,422,600 | $1,056,300 | $366,300 |
| 2020 | $7,624 | $1,422,600 | $1,056,300 | $366,300 |
| 2019 | $9,483 | $0 | $0 | $0 |
| 2018 | -- | $1,393,300 | $1,056,300 | $337,000 |
| 2017 | $7,355 | $1,280,200 | $943,200 | $337,000 |
| 2016 | $6,522 | $1,091,500 | $754,500 | $337,000 |
| 2015 | -- | $1,091,500 | $754,500 | $337,000 |
| 2014 | -- | $1,091,500 | $754,500 | $337,000 |
Source: Public Records
Map
Nearby Homes