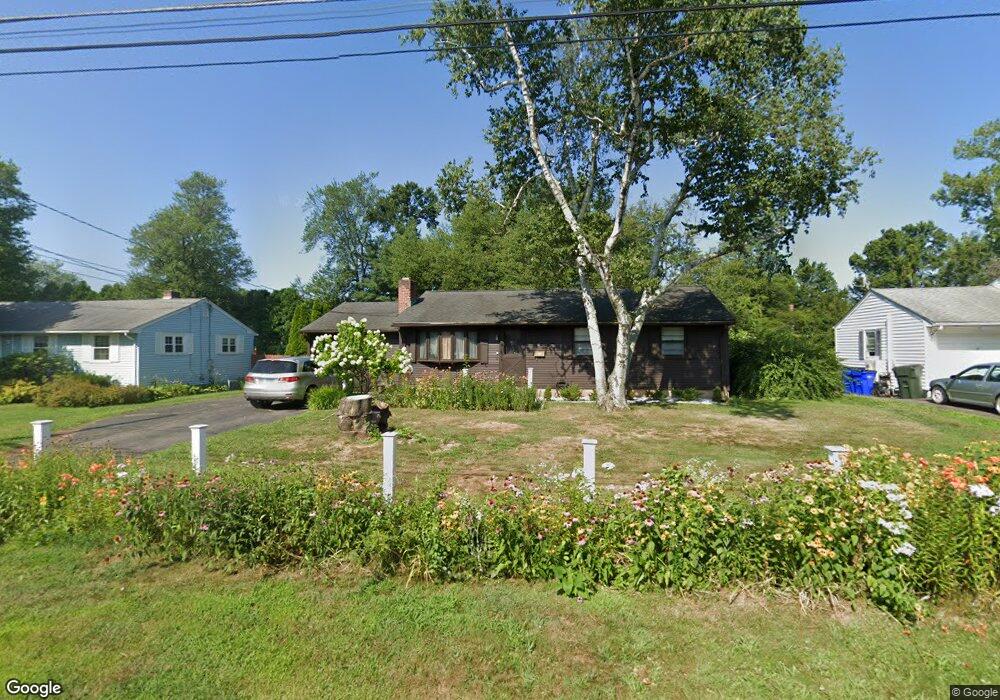
11 Belaire Cir Windsor Locks, CT 06096
Estimated Value: $334,000 - $355,000
3
Beds
3
Baths
960
Sq Ft
$360/Sq Ft
Est. Value
About This Home
This home is located at 11 Belaire Cir, Windsor Locks, CT 06096 and is currently estimated at $345,342, approximately $359 per square foot. 11 Belaire Cir is a home located in Hartford County with nearby schools including North Street School, South Elementary School, and Windsor Locks Middle School.
Ownership History
Date
Name
Owned For
Owner Type
Purchase Details
Closed on
Oct 29, 2024
Sold by
Preste Carol
Bought by
Rodriguez Benjamin
Current Estimated Value
Home Financials for this Owner
Home Financials are based on the most recent Mortgage that was taken out on this home.
Original Mortgage
$320,193
Outstanding Balance
$316,658
Interest Rate
6.09%
Mortgage Type
FHA
Estimated Equity
$28,684
Create a Home Valuation Report for This Property
The Home Valuation Report is an in-depth analysis detailing your home's value as well as a comparison with similar homes in the area
Home Values in the Area
Average Home Value in this Area
Purchase History
| Date | Buyer | Sale Price | Title Company |
|---|---|---|---|
| Rodriguez Benjamin | $326,100 | None Available | |
| Rodriguez Benjamin | $326,100 | None Available |
Source: Public Records
Mortgage History
| Date | Status | Borrower | Loan Amount |
|---|---|---|---|
| Open | Rodriguez Benjamin | $320,193 | |
| Closed | Rodriguez Benjamin | $320,193 |
Source: Public Records
Tax History Compared to Growth
Tax History
| Year | Tax Paid | Tax Assessment Tax Assessment Total Assessment is a certain percentage of the fair market value that is determined by local assessors to be the total taxable value of land and additions on the property. | Land | Improvement |
|---|---|---|---|---|
| 2025 | $5,271 | $219,730 | $56,910 | $162,820 |
| 2024 | $3,425 | $121,730 | $42,700 | $79,030 |
| 2023 | $3,205 | $121,730 | $42,700 | $79,030 |
| 2022 | $3,144 | $121,730 | $42,700 | $79,030 |
| 2021 | $3,144 | $121,730 | $42,700 | $79,030 |
| 2020 | $3,144 | $121,730 | $42,700 | $79,030 |
| 2019 | $3,144 | $121,730 | $42,700 | $79,030 |
| 2017 | $3,018 | $113,200 | $41,700 | $71,500 |
| 2016 | $3,018 | $113,200 | $41,700 | $71,500 |
| 2015 | $3,033 | $113,200 | $41,700 | $71,500 |
| 2014 | $3,452 | $131,600 | $47,300 | $84,300 |
Source: Public Records
Map
Nearby Homes
- 60 Tracy Cir
- 136 S Center St
- 29 Coolidge St
- 12 Woodridge Dr Unit 12
- 32 School St
- 106 Orchard Hill Dr
- 18 Laurel Cir
- 114 Elm St
- 59 Elm St
- 190 Elm St
- 5 Riverview Dr Unit C
- 10 Center St
- 65 Greenfield Dr
- 7 Frances Ln
- 31 Laurel Rd
- 35 George Rd
- 7 Glenbrook Dr
- 377 Hayden Station Rd
- 66 Center St
- 22 Chestnut St Unit 24