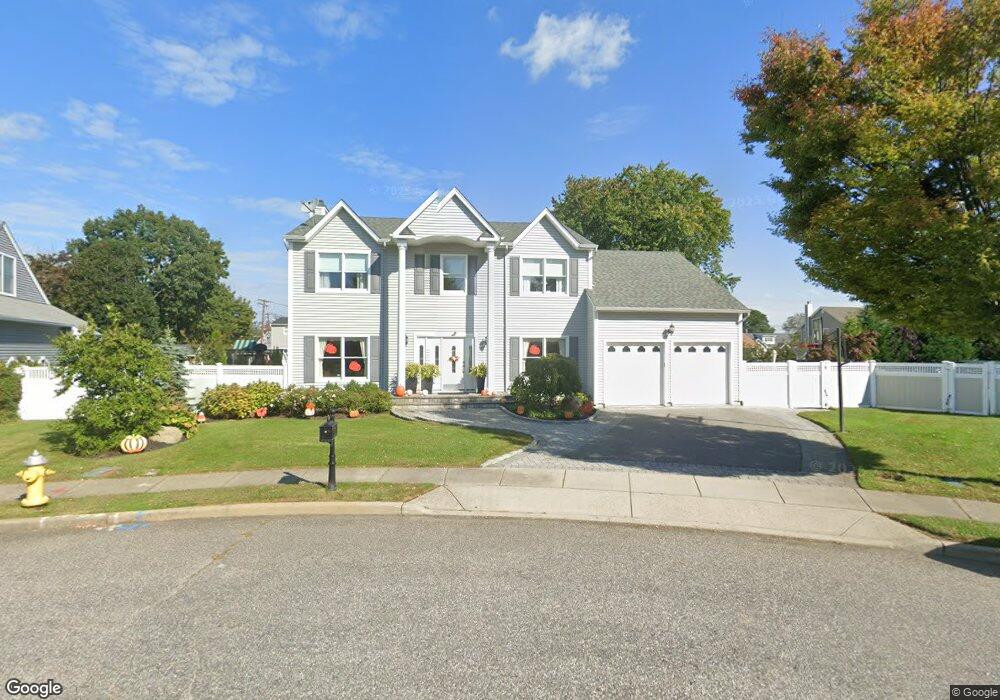
11 Bells Ct West Islip, NY 11795
Estimated Value: $965,000 - $1,222,000
5
Beds
3
Baths
3,000
Sq Ft
$359/Sq Ft
Est. Value
About This Home
This home is located at 11 Bells Ct, West Islip, NY 11795 and is currently estimated at $1,076,591, approximately $358 per square foot. 11 Bells Ct is a home located in Suffolk County with nearby schools including Oquenock Elementary School, Udall Road Middle School, and West Islip Senior High School.
Ownership History
Date
Name
Owned For
Owner Type
Purchase Details
Closed on
Jun 17, 2016
Sold by
Chi Charles and Chi Myra
Bought by
Fisher Charles M and Fisher Theresa
Current Estimated Value
Home Financials for this Owner
Home Financials are based on the most recent Mortgage that was taken out on this home.
Original Mortgage
$508,000
Outstanding Balance
$404,443
Interest Rate
3.58%
Mortgage Type
New Conventional
Estimated Equity
$672,148
Purchase Details
Closed on
Feb 1, 2007
Sold by
Rocmar Construction Inc
Bought by
Chi Charles
Create a Home Valuation Report for This Property
The Home Valuation Report is an in-depth analysis detailing your home's value as well as a comparison with similar homes in the area
Home Values in the Area
Average Home Value in this Area
Purchase History
| Date | Buyer | Sale Price | Title Company |
|---|---|---|---|
| Fisher Charles M | $635,000 | None Available | |
| Chi Charles | $787,000 | Myra Chi |
Source: Public Records
Mortgage History
| Date | Status | Borrower | Loan Amount |
|---|---|---|---|
| Open | Fisher Charles M | $508,000 |
Source: Public Records
Tax History Compared to Growth
Tax History
| Year | Tax Paid | Tax Assessment Tax Assessment Total Assessment is a certain percentage of the fair market value that is determined by local assessors to be the total taxable value of land and additions on the property. | Land | Improvement |
|---|---|---|---|---|
| 2024 | $16,847 | $57,800 | $9,300 | $48,500 |
| 2023 | $16,847 | $57,800 | $9,300 | $48,500 |
| 2022 | $14,671 | $57,800 | $9,300 | $48,500 |
| 2021 | $14,671 | $57,800 | $9,300 | $48,500 |
| 2020 | $16,067 | $57,800 | $9,300 | $48,500 |
| 2019 | $16,067 | $0 | $0 | $0 |
| 2018 | -- | $57,800 | $9,300 | $48,500 |
| 2017 | $15,481 | $57,800 | $9,300 | $48,500 |
| 2016 | $14,376 | $57,800 | $9,300 | $48,500 |
| 2015 | -- | $57,800 | $9,300 | $48,500 |
| 2014 | -- | $57,800 | $9,300 | $48,500 |
Source: Public Records
Map
Nearby Homes