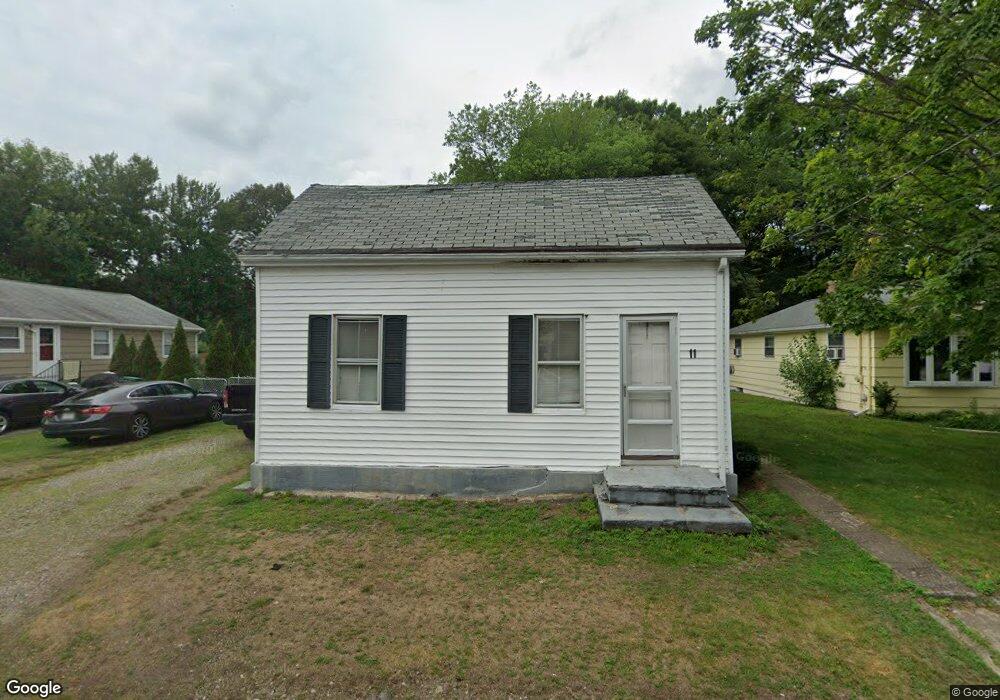
11 Benner Place Attleboro, MA 02703
Estimated Value: $277,000 - $444,000
2
Beds
1
Bath
821
Sq Ft
$430/Sq Ft
Est. Value
About This Home
This home is located at 11 Benner Place, Attleboro, MA 02703 and is currently estimated at $353,427, approximately $430 per square foot. 11 Benner Place is a home located in Bristol County with nearby schools including Hill-Roberts Elementary School, Robert J. Coelho Middle School, and Attleboro High School.
Ownership History
Date
Name
Owned For
Owner Type
Purchase Details
Closed on
Sep 16, 2024
Sold by
Parent George D
Bought by
Parent George D and Parent Ryan M
Current Estimated Value
Purchase Details
Closed on
Aug 5, 2022
Sold by
Parent George D
Bought by
Parent George D
Purchase Details
Closed on
Feb 22, 2007
Sold by
Parent George D
Bought by
Parent George D and Parent Barbara A
Purchase Details
Closed on
Dec 18, 1995
Sold by
Weitzner Lorrine and Marcus Lorraine
Bought by
Parent George D
Home Financials for this Owner
Home Financials are based on the most recent Mortgage that was taken out on this home.
Original Mortgage
$47,500
Interest Rate
7.43%
Mortgage Type
Purchase Money Mortgage
Create a Home Valuation Report for This Property
The Home Valuation Report is an in-depth analysis detailing your home's value as well as a comparison with similar homes in the area
Home Values in the Area
Average Home Value in this Area
Purchase History
| Date | Buyer | Sale Price | Title Company |
|---|---|---|---|
| Parent George D | -- | None Available | |
| Parent George D | -- | None Available | |
| Parent George D | -- | None Available | |
| Parent George D | -- | None Available | |
| Parent George D | $82,000 | -- | |
| Parent George D | $50,000 | -- | |
| Parent George D | $82,000 | -- | |
| Parent George D | $50,000 | -- |
Source: Public Records
Mortgage History
| Date | Status | Borrower | Loan Amount |
|---|---|---|---|
| Previous Owner | Parent George D | $23,600 | |
| Previous Owner | Parent George D | $47,500 |
Source: Public Records
Tax History Compared to Growth
Tax History
| Year | Tax Paid | Tax Assessment Tax Assessment Total Assessment is a certain percentage of the fair market value that is determined by local assessors to be the total taxable value of land and additions on the property. | Land | Improvement |
|---|---|---|---|---|
| 2025 | $2,838 | $226,100 | $124,900 | $101,200 |
| 2024 | $2,860 | $224,700 | $124,900 | $99,800 |
| 2023 | $2,764 | $201,900 | $113,600 | $88,300 |
| 2022 | $2,706 | $187,300 | $108,200 | $79,100 |
| 2021 | $2,535 | $171,300 | $104,000 | $67,300 |
| 2020 | $2,474 | $169,900 | $101,000 | $68,900 |
| 2019 | $2,322 | $164,000 | $99,000 | $65,000 |
| 2018 | $2,242 | $151,300 | $96,100 | $55,200 |
| 2017 | $2,219 | $152,500 | $96,100 | $56,400 |
| 2016 | $2,186 | $147,500 | $94,300 | $53,200 |
| 2015 | $2,039 | $138,600 | $94,300 | $44,300 |
| 2014 | $1,974 | $132,900 | $89,800 | $43,100 |
Source: Public Records
Map
Nearby Homes
- 44 Buffington St
- 23 Magnolia St Unit 2
- 12 Tyson Place
- 39 Slade Ave
- 64 Highland Ave Unit A
- 64 Highland Ave Unit B
- 130 Zoar Ave
- 1 Jessicas Way
- 980 Newport Ave
- 2 Gardner Ave
- 103 Hall Ave
- 27 Killarney Way
- 52 Curtis Ave
- 59 Samuel Way
- 330 Brown St
- 517 Newport Ave
- 500 Mendon Rd Unit 257
- 58 Baltic St Unit 58
- 56 Baltic St Unit 56
- 6 Castle Rd
- 5 Benner Place
- 17 Benner Place
- 23 Benner Place
- 541 Washington St
- 537 & 541 Washington St
- 537 Washington St 2nd Floor Front Unit 3
- 537 Washington St Unit 1
- 537 Washington St
- 26 Benner Place
- 31 Benner Place
- 581 Washington St
- 38 Benner Place
- 25 Benner Place
- Lot A Phillips St
- D5 Newport Avenue 1346
- LOT 3 Brushwood Ln
- 11 Horton Ave
- 11 Horton Ave Unit 1
- 11 Horton Ave Unit 2
- 49 Quinton Ave