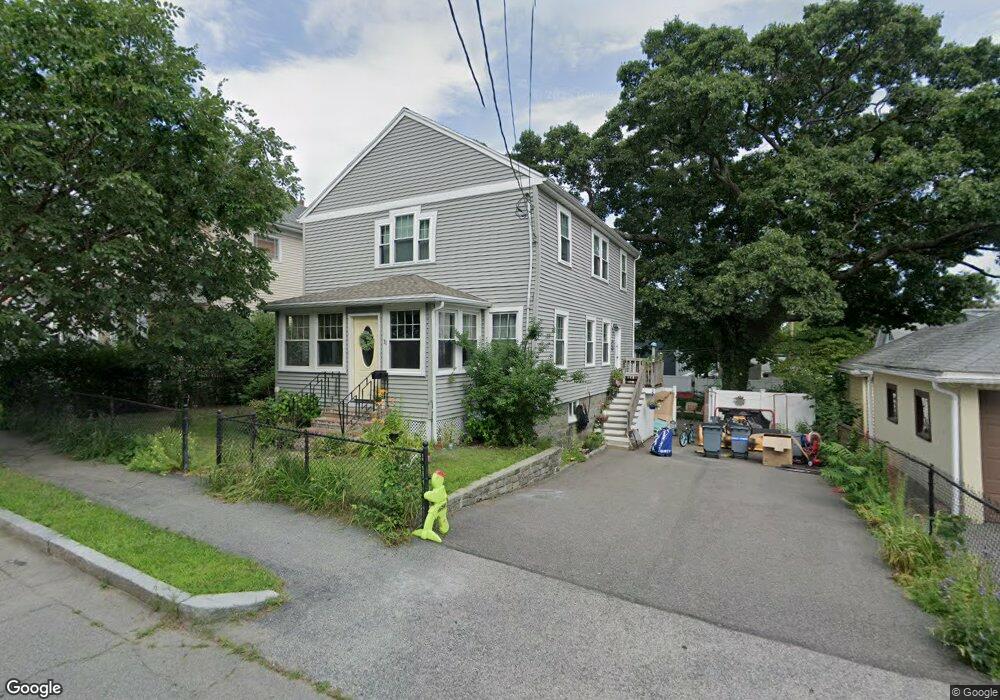
11 Berkeley St Quincy, MA 02169
Quincy Point NeighborhoodEstimated Value: $720,000 - $796,000
3
Beds
2
Baths
1,836
Sq Ft
$410/Sq Ft
Est. Value
About This Home
This home is located at 11 Berkeley St, Quincy, MA 02169 and is currently estimated at $753,227, approximately $410 per square foot. 11 Berkeley St is a home located in Norfolk County with nearby schools including Point Webster Middle School, Clifford H. Marshall Elementary School, and Quincy High School.
Ownership History
Date
Name
Owned For
Owner Type
Purchase Details
Closed on
Oct 15, 2003
Sold by
Barber Ronald L and Barber Judith D
Bought by
Christian Gregory S and Christian Kristen S
Current Estimated Value
Home Financials for this Owner
Home Financials are based on the most recent Mortgage that was taken out on this home.
Original Mortgage
$242,250
Outstanding Balance
$114,751
Interest Rate
6.43%
Mortgage Type
Purchase Money Mortgage
Estimated Equity
$638,476
Create a Home Valuation Report for This Property
The Home Valuation Report is an in-depth analysis detailing your home's value as well as a comparison with similar homes in the area
Home Values in the Area
Average Home Value in this Area
Purchase History
| Date | Buyer | Sale Price | Title Company |
|---|---|---|---|
| Christian Gregory S | $255,000 | -- |
Source: Public Records
Mortgage History
| Date | Status | Borrower | Loan Amount |
|---|---|---|---|
| Open | Christian Gregory S | $242,250 |
Source: Public Records
Tax History
| Year | Tax Paid | Tax Assessment Tax Assessment Total Assessment is a certain percentage of the fair market value that is determined by local assessors to be the total taxable value of land and additions on the property. | Land | Improvement |
|---|---|---|---|---|
| 2025 | $7,893 | $684,600 | $283,700 | $400,900 |
| 2024 | $7,471 | $662,900 | $270,200 | $392,700 |
| 2023 | $6,796 | $610,600 | $245,600 | $365,000 |
| 2022 | $6,775 | $565,500 | $223,300 | $342,200 |
| 2021 | $6,636 | $546,600 | $223,300 | $323,300 |
| 2020 | $6,384 | $513,600 | $210,700 | $302,900 |
| 2019 | $6,067 | $483,400 | $195,100 | $288,300 |
| 2018 | $5,915 | $443,400 | $177,300 | $266,100 |
| 2017 | $5,803 | $409,500 | $168,900 | $240,600 |
| 2016 | $5,417 | $377,200 | $153,500 | $223,700 |
| 2015 | $5,101 | $349,400 | $144,800 | $204,600 |
| 2014 | $5,003 | $336,700 | $144,800 | $191,900 |
Source: Public Records
Map
Nearby Homes
- 62 South St Unit 7
- 72 Main St
- 51 Sumner St
- 5 Main St
- 123 Elm St Unit D-12
- 17-19 Lowe St
- 101 Sumner St Unit B
- 33 Elm St
- 44 Elm St
- 35 Miller Stile Rd
- 135 Sumner St Unit 1
- 161 Sumner St Unit 2
- 2 Cliveden St Unit 601E
- 2 Cliveden St Unit 405E
- 388 Washington St Unit 101
- 388 Washington St Unit 302
- 388 Washington St Unit 301
- 388 Washington St Unit 205
- 388 Washington St Unit 401
- 388 Washington St Unit 202
- 15 Berkeley St
- 15 Berkeley St Unit 2
- 110 South St
- 108 South St
- 112 South St
- 10 Clarendon St
- 19 Berkeley St
- 116 South St
- 14 Clarendon St
- 6 Berkeley St
- 14 Berkeley St
- 10 Berkeley St
- 10 Berkeley St Unit 1
- 10 Berkeley St Unit 12
- 10-12 Berkeley St Unit 1
- 18 Berkeley St
- 00 Berkely St
- 16 Clarendon St
- 27 Berkeley St
- 96 South St
Your Personal Tour Guide
Ask me questions while you tour the home.