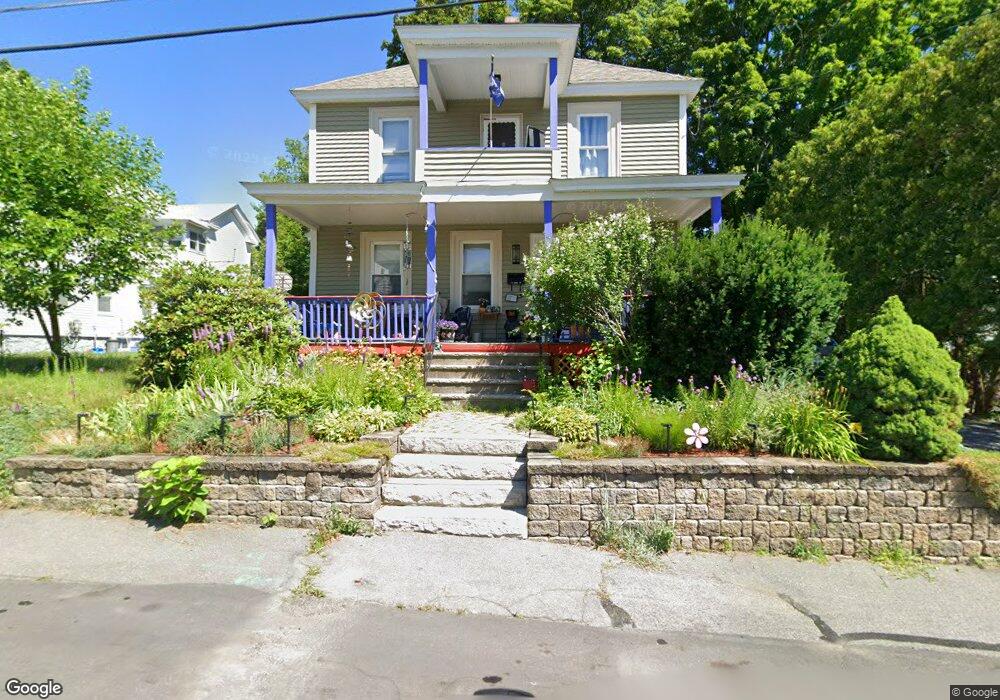
11 Bond St Lowell, MA 01851
Highlands NeighborhoodEstimated Value: $478,000 - $584,000
4
Beds
2
Baths
2,229
Sq Ft
$238/Sq Ft
Est. Value
About This Home
This home is located at 11 Bond St, Lowell, MA 01851 and is currently estimated at $531,465, approximately $238 per square foot. 11 Bond St is a home located in Middlesex County with nearby schools including Charles W. Morey Elementary School, Dr. Gertrude Bailey Elementary School, and Abraham Lincoln Elementary School.
Ownership History
Date
Name
Owned For
Owner Type
Purchase Details
Closed on
Mar 28, 1996
Sold by
Noel Roland J and Noel Rita
Bought by
Schneider John R and Gaynor Mary
Current Estimated Value
Home Financials for this Owner
Home Financials are based on the most recent Mortgage that was taken out on this home.
Original Mortgage
$82,800
Interest Rate
6.9%
Mortgage Type
Purchase Money Mortgage
Create a Home Valuation Report for This Property
The Home Valuation Report is an in-depth analysis detailing your home's value as well as a comparison with similar homes in the area
Home Values in the Area
Average Home Value in this Area
Purchase History
| Date | Buyer | Sale Price | Title Company |
|---|---|---|---|
| Schneider John R | $92,000 | -- | |
| Schneider John R | $92,000 | -- |
Source: Public Records
Mortgage History
| Date | Status | Borrower | Loan Amount |
|---|---|---|---|
| Open | Schneider John R | $160,000 | |
| Closed | Schneider John R | $82,800 | |
| Previous Owner | Schneider John R | $50,000 |
Source: Public Records
Tax History Compared to Growth
Tax History
| Year | Tax Paid | Tax Assessment Tax Assessment Total Assessment is a certain percentage of the fair market value that is determined by local assessors to be the total taxable value of land and additions on the property. | Land | Improvement |
|---|---|---|---|---|
| 2025 | $5,004 | $435,900 | $144,500 | $291,400 |
| 2024 | $4,895 | $411,000 | $136,300 | $274,700 |
| 2023 | $4,610 | $371,200 | $118,500 | $252,700 |
| 2022 | $4,330 | $341,200 | $107,800 | $233,400 |
| 2021 | $4,038 | $300,000 | $93,700 | $206,300 |
| 2020 | $3,804 | $284,700 | $88,700 | $196,000 |
| 2019 | $3,603 | $256,600 | $86,000 | $170,600 |
| 2018 | $3,521 | $244,700 | $81,900 | $162,800 |
| 2017 | $3,282 | $220,000 | $67,700 | $152,300 |
| 2016 | $3,090 | $203,800 | $64,400 | $139,400 |
| 2015 | $2,994 | $193,400 | $64,400 | $129,000 |
| 2013 | $2,828 | $188,400 | $75,400 | $113,000 |
Source: Public Records
Map
Nearby Homes
- 337 Stevens St Unit D
- 90 Belmont St
- 17 Oakland St
- 18 Edson St
- 312 Wilder St
- 613 School St
- 30 Livingston Ave
- 41 Coral St
- 1280 Middlesex St
- 1149 Middlesex St
- 15 Sayles St
- 31 Waite St
- 1311 Middlesex St
- 90 Rindo Park Dr
- 60 Liberty St Unit 3
- 984 Middlesex St
- 15 Barclay St
- 11 Columbus Ave
- 987 Middlesex St
- 23 Mckinley Ave
- 19 Bond St
- 301 Stevens St
- 293 Stevens St
- 25 Bond St
- 12 Bond St
- 311 Stevens St
- 16 Bond St
- 28 Bond St
- 206 Pine St Unit 206R
- 210 Pine St Unit 210F
- 208 Pine St Unit 208F
- 285 Stevens St
- 319 Stevens St
- 30 Highland Ave
- 302 Stevens St
- 306 Stevens St
- 323 Stevens St
- 296 Stevens St
- 198 Pine St
- 198 Pine St Unit 1