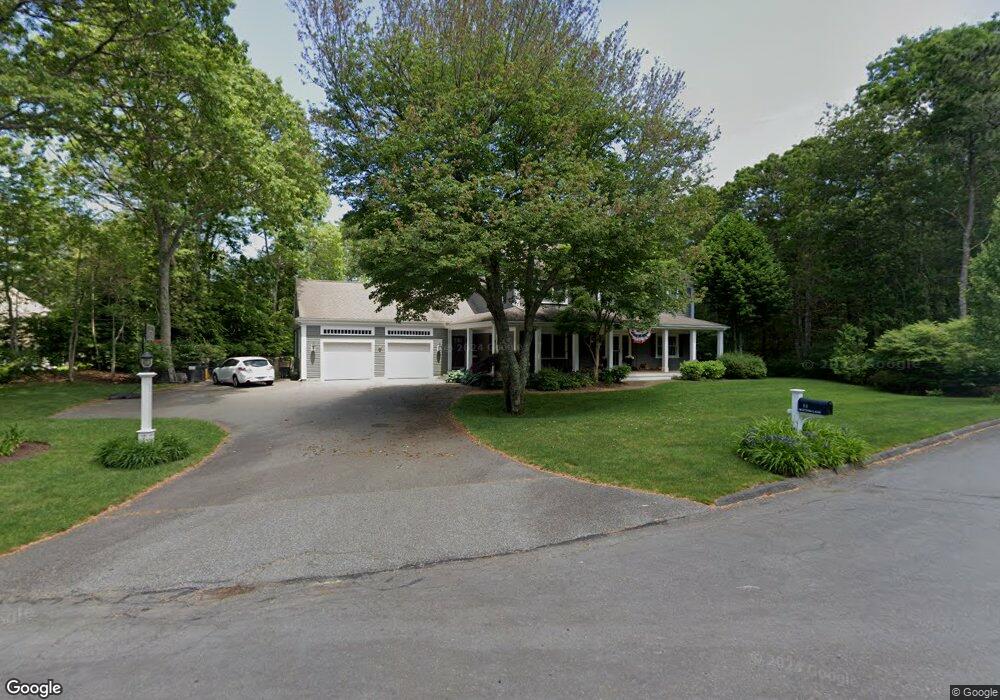
11 Bottom Ln Sandwich, MA 02563
Estimated Value: $947,000 - $1,196,000
5
Beds
4
Baths
3,477
Sq Ft
$318/Sq Ft
Est. Value
About This Home
This home is located at 11 Bottom Ln, Sandwich, MA 02563 and is currently estimated at $1,107,347, approximately $318 per square foot. 11 Bottom Ln is a home located in Barnstable County with nearby schools including Sandwich Middle High School, Montessori School of Sandwich, and Riverview School.
Ownership History
Date
Name
Owned For
Owner Type
Purchase Details
Closed on
May 16, 2008
Sold by
Ellis Denise K
Bought by
Ramsey Brenden M and Ramsey Kelly M
Current Estimated Value
Home Financials for this Owner
Home Financials are based on the most recent Mortgage that was taken out on this home.
Original Mortgage
$275,000
Outstanding Balance
$174,429
Interest Rate
5.91%
Mortgage Type
Purchase Money Mortgage
Estimated Equity
$932,918
Purchase Details
Closed on
Jul 1, 1998
Sold by
Paska Edward A and Paska Maria
Bought by
Ellis Denise K
Create a Home Valuation Report for This Property
The Home Valuation Report is an in-depth analysis detailing your home's value as well as a comparison with similar homes in the area
Home Values in the Area
Average Home Value in this Area
Purchase History
| Date | Buyer | Sale Price | Title Company |
|---|---|---|---|
| Ramsey Brenden M | $450,000 | -- | |
| Ellis Denise K | $360,000 | -- |
Source: Public Records
Mortgage History
| Date | Status | Borrower | Loan Amount |
|---|---|---|---|
| Open | Ramsey Brenden M | $275,000 |
Source: Public Records
Tax History Compared to Growth
Tax History
| Year | Tax Paid | Tax Assessment Tax Assessment Total Assessment is a certain percentage of the fair market value that is determined by local assessors to be the total taxable value of land and additions on the property. | Land | Improvement |
|---|---|---|---|---|
| 2025 | $10,356 | $979,800 | $133,900 | $845,900 |
| 2024 | $10,535 | $975,500 | $135,500 | $840,000 |
| 2023 | $10,313 | $896,800 | $123,200 | $773,600 |
| 2022 | $9,777 | $742,900 | $119,000 | $623,900 |
| 2021 | $9,209 | $668,800 | $114,400 | $554,400 |
| 2020 | $9,134 | $638,300 | $112,400 | $525,900 |
| 2019 | $8,751 | $611,100 | $119,300 | $491,800 |
| 2018 | $22 | $579,100 | $115,200 | $463,900 |
| 2017 | $8,123 | $544,100 | $111,500 | $432,600 |
| 2016 | $7,769 | $536,900 | $110,300 | $426,600 |
| 2015 | $7,893 | $532,600 | $114,300 | $418,300 |
Source: Public Records
Map
Nearby Homes
- 7 Highfield Dr
- 3 Anne Cir
- 159 Great Hill Rd
- 15 Hunters Tr
- 15 Hunters Trail
- 159 Cinderella Terrace
- 315 Blackthorn Rd
- 10 Wintergreen Ln
- 65 Bosuns Way
- 3 Glenwood Ln
- 34 White Moss Dr
- 5 Aviators Ln
- 289 Santuit-Newtown Rd
- 239 Whistleberry Dr
- 6 Harpers Hollow
- 58 Southpoint Dr Unit J
- 34 Southpoint Dr
- 17 Southpoint Dr Unit 17