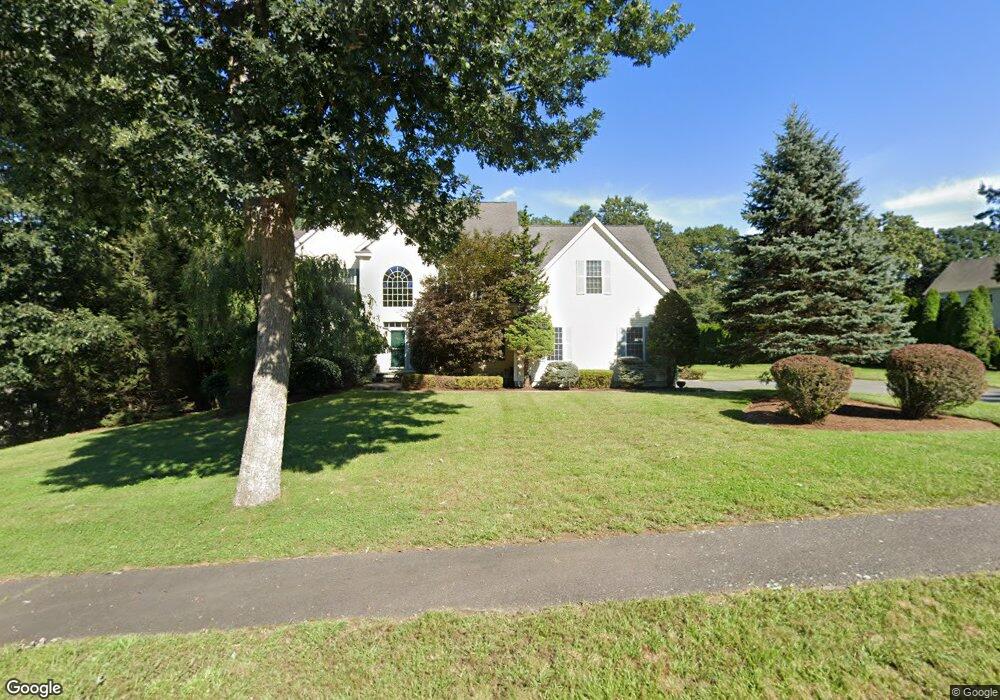
11 Boulder Rd Holliston, MA 01746
Estimated Value: $973,000 - $1,212,000
4
Beds
3
Baths
3,176
Sq Ft
$343/Sq Ft
Est. Value
About This Home
This home is located at 11 Boulder Rd, Holliston, MA 01746 and is currently estimated at $1,088,251, approximately $342 per square foot. 11 Boulder Rd is a home located in Middlesex County with nearby schools including Miller Elementary School, Robert H. Adams Middle School, and Holliston High School.
Ownership History
Date
Name
Owned For
Owner Type
Purchase Details
Closed on
May 1, 2008
Sold by
Florian Kara L and Gargiulo Kara L
Bought by
Kashyap Nishmin and Garrettson Thomas
Current Estimated Value
Purchase Details
Closed on
Sep 25, 2007
Sold by
Gargiulo Joseph A and Gargiulo Kara L
Bought by
Gargiulo Kara L
Purchase Details
Closed on
Oct 18, 2001
Sold by
Oak Ridge Constr Co
Bought by
Grason Bldrs Inc
Create a Home Valuation Report for This Property
The Home Valuation Report is an in-depth analysis detailing your home's value as well as a comparison with similar homes in the area
Home Values in the Area
Average Home Value in this Area
Purchase History
| Date | Buyer | Sale Price | Title Company |
|---|---|---|---|
| Kashyap Nishmin | $665,000 | -- | |
| Kashyap Nishmin | $665,000 | -- | |
| Gargiulo Kara L | -- | -- | |
| Gargiulo Kara L | -- | -- | |
| Grason Bldrs Inc | $225,000 | -- | |
| Grason Bldrs Inc | $225,000 | -- |
Source: Public Records
Mortgage History
| Date | Status | Borrower | Loan Amount |
|---|---|---|---|
| Open | Grason Bldrs Inc | $365,000 | |
| Closed | Grason Bldrs Inc | $400,000 | |
| Closed | Grason Bldrs Inc | $200,000 |
Source: Public Records
Tax History Compared to Growth
Tax History
| Year | Tax Paid | Tax Assessment Tax Assessment Total Assessment is a certain percentage of the fair market value that is determined by local assessors to be the total taxable value of land and additions on the property. | Land | Improvement |
|---|---|---|---|---|
| 2025 | $13,460 | $918,800 | $285,600 | $633,200 |
| 2024 | $13,411 | $890,500 | $285,600 | $604,900 |
| 2023 | $12,891 | $837,100 | $285,600 | $551,500 |
| 2022 | $12,274 | $706,200 | $285,600 | $420,600 |
| 2021 | $12,327 | $690,600 | $270,000 | $420,600 |
| 2020 | $12,205 | $647,500 | $254,800 | $392,700 |
| 2019 | $12,049 | $639,900 | $247,200 | $392,700 |
| 2018 | $11,947 | $639,900 | $247,200 | $392,700 |
| 2017 | $11,812 | $637,800 | $260,000 | $377,800 |
| 2016 | $11,825 | $629,300 | $242,800 | $386,500 |
| 2015 | $11,651 | $601,200 | $210,000 | $391,200 |
Source: Public Records
Map
Nearby Homes
- 156 Mitchell Rd
- 1366 Washington St
- 154 Union St
- 121 Bullard St
- 30 Powderhorn Ln
- 11 Francine Dr
- 160 Winter St
- 266 Willowgate Rise
- 195 High St
- 43 Bittersweet Cir Unit 43
- 27 Richardson Dr Unit 27
- 54 Westfield Dr
- 1037 Washington St
- 56 Roy Ave
- 6 Brook St
- 625 Norfolk St
- 140 Goulding St
- 1 Jameson Dr Unit 1
- 3 Jameson Dr Unit 3
- 131 Jennings Rd