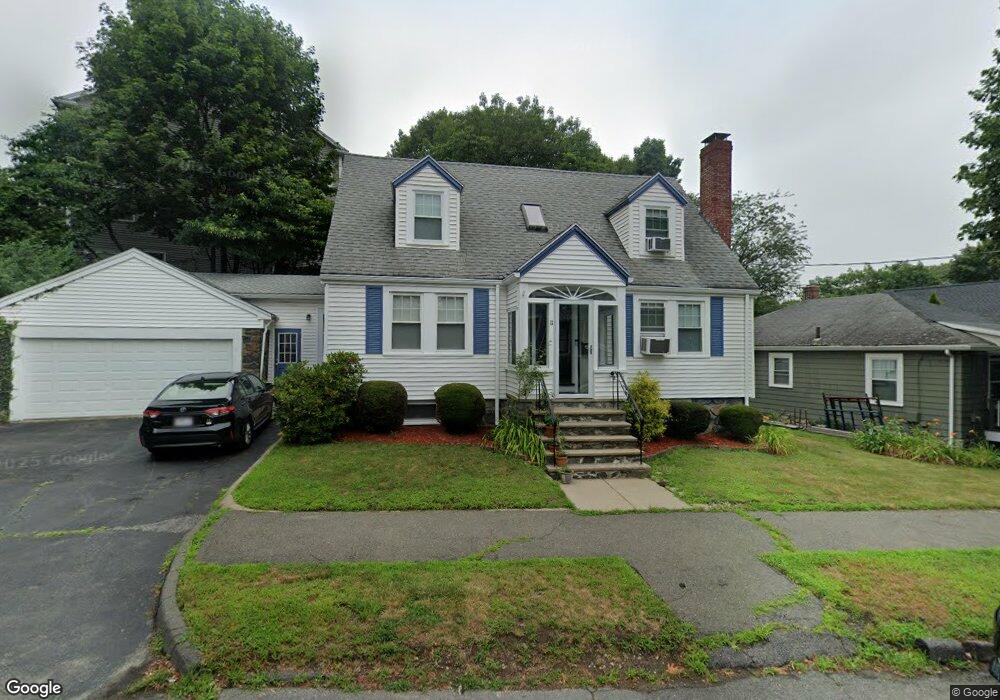
11 Boulder Way Swampscott, MA 01907
Estimated Value: $686,000 - $739,000
3
Beds
2
Baths
1,607
Sq Ft
$442/Sq Ft
Est. Value
About This Home
This home is located at 11 Boulder Way, Swampscott, MA 01907 and is currently estimated at $710,620, approximately $442 per square foot. 11 Boulder Way is a home located in Essex County with nearby schools including Swampscott Middle School and Swampscott High School.
Ownership History
Date
Name
Owned For
Owner Type
Purchase Details
Closed on
Oct 1, 2021
Sold by
Ginsburg Michael H
Bought by
Ginsburg Karen M and Ginsburg Michael H
Current Estimated Value
Purchase Details
Closed on
Jan 21, 2021
Sold by
Ginsburg Karen M and Ginsburg Michael H
Bought by
Ginsburg Michael H
Home Financials for this Owner
Home Financials are based on the most recent Mortgage that was taken out on this home.
Original Mortgage
$440,000
Interest Rate
2.6%
Mortgage Type
New Conventional
Purchase Details
Closed on
Aug 29, 1997
Sold by
Caruso Frank
Bought by
Ginsburg Michael H and Ginsberg Karen M
Create a Home Valuation Report for This Property
The Home Valuation Report is an in-depth analysis detailing your home's value as well as a comparison with similar homes in the area
Home Values in the Area
Average Home Value in this Area
Purchase History
| Date | Buyer | Sale Price | Title Company |
|---|---|---|---|
| Ginsburg Karen M | -- | None Available | |
| Ginsburg Karen M | -- | None Available | |
| Ginsburg Michael H | -- | None Available | |
| Ginsburg Michael H | -- | None Available | |
| Ginsburg Michael H | $172,500 | -- | |
| Ginsburg Michael H | $172,500 | -- |
Source: Public Records
Mortgage History
| Date | Status | Borrower | Loan Amount |
|---|---|---|---|
| Previous Owner | Ginsburg Michael H | $440,000 | |
| Previous Owner | Ginsburg Michael H | $376,000 | |
| Previous Owner | Ginsburg Michael H | $369,600 |
Source: Public Records
Tax History Compared to Growth
Tax History
| Year | Tax Paid | Tax Assessment Tax Assessment Total Assessment is a certain percentage of the fair market value that is determined by local assessors to be the total taxable value of land and additions on the property. | Land | Improvement |
|---|---|---|---|---|
| 2025 | $6,530 | $569,300 | $240,200 | $329,100 |
| 2024 | $6,383 | $555,500 | $228,800 | $326,700 |
| 2023 | $6,212 | $529,100 | $228,800 | $300,300 |
| 2022 | $5,962 | $464,700 | $194,900 | $269,800 |
| 2021 | $5,539 | $401,400 | $152,500 | $248,900 |
| 2020 | $5,741 | $401,500 | $152,500 | $249,000 |
| 2019 | $5,846 | $384,600 | $135,600 | $249,000 |
| 2018 | $5,715 | $357,200 | $118,600 | $238,600 |
| 2017 | $5,793 | $332,000 | $110,100 | $221,900 |
| 2016 | $5,608 | $323,600 | $101,700 | $221,900 |
| 2015 | $5,550 | $323,600 | $101,700 | $221,900 |
| 2014 | $5,073 | $271,300 | $84,700 | $186,600 |
Source: Public Records
Map
Nearby Homes
- 16 Duke St
- 3 Nantucket Ave
- 24 Barnstable St
- 5 Summit View Dr
- 89 Essex St Unit 2
- 8 Ryan Place
- 445 Essex St Unit 304
- 306 Paradise Rd
- 16 Jessie St
- 44 Cherry St Unit 2
- 211 Burrill St
- 309 Paradise Rd
- 41 Roy St
- 189 Burrill St Unit 2
- 150 Windsor Ave
- 2 Shackle Way Unit 2
- 72 Hillside Ave
- 13 Essex St Unit 2
- 9 Sampson Ave
- 140 Elmwood Rd