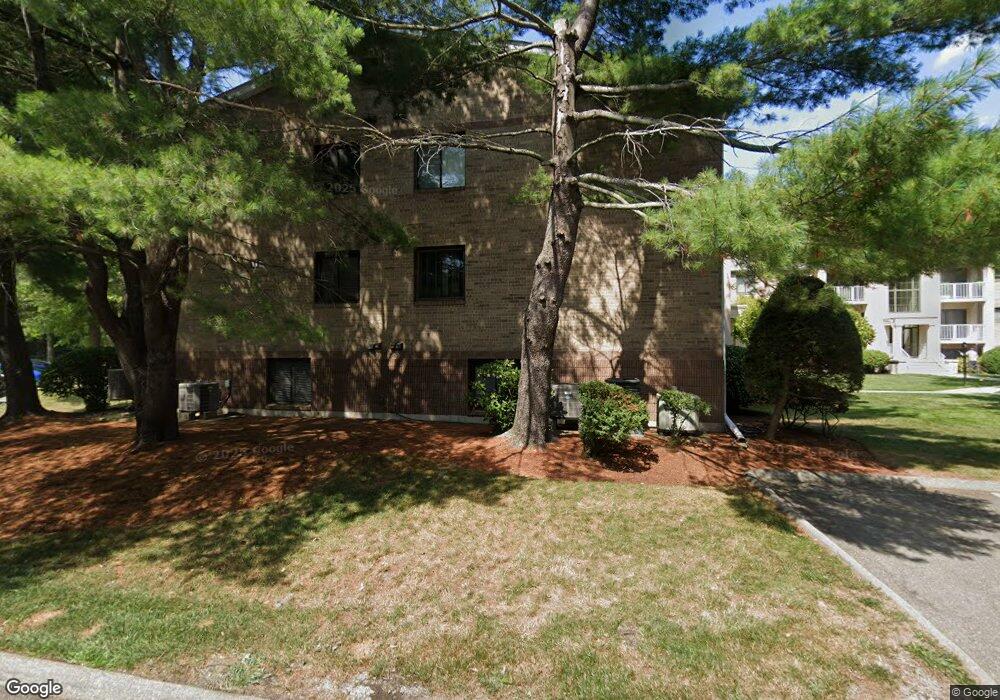
11 Bourbon St Unit 42 Peabody, MA 01960
Estimated Value: $419,863 - $451,000
2
Beds
1
Bath
950
Sq Ft
$455/Sq Ft
Est. Value
About This Home
This home is located at 11 Bourbon St Unit 42, Peabody, MA 01960 and is currently estimated at $431,966, approximately $454 per square foot. 11 Bourbon St Unit 42 is a home located in Essex County with nearby schools including Peabody Veterans Memorial High School, Covenant Christian Academy, and Our Lady Of Assumption School.
Ownership History
Date
Name
Owned For
Owner Type
Purchase Details
Closed on
Aug 18, 2021
Sold by
Farnkoff Daniel J
Bought by
Farnkoff Donna M
Current Estimated Value
Purchase Details
Closed on
May 31, 2001
Sold by
Cohen Karen M and Daly Karen M
Bought by
Farnkoff Daniel J and Farnkoff Donna M
Home Financials for this Owner
Home Financials are based on the most recent Mortgage that was taken out on this home.
Original Mortgage
$161,900
Interest Rate
7.09%
Mortgage Type
Purchase Money Mortgage
Purchase Details
Closed on
Dec 29, 1997
Sold by
Cummings Jeannette M
Bought by
Daly Karen M
Purchase Details
Closed on
Jan 13, 1992
Sold by
Ccarthy Vincent and Mccarthy Virginia
Bought by
Cummings Jeannette M
Purchase Details
Closed on
Mar 16, 1988
Sold by
Court Yrd Dev Corp
Bought by
Mccarthy Vincent A
Create a Home Valuation Report for This Property
The Home Valuation Report is an in-depth analysis detailing your home's value as well as a comparison with similar homes in the area
Purchase History
| Date | Buyer | Sale Price | Title Company |
|---|---|---|---|
| Farnkoff Donna M | -- | None Available | |
| Farnkoff Daniel J | $161,900 | -- | |
| Daly Karen M | $116,000 | -- | |
| Cummings Jeannette M | $95,000 | -- | |
| Mccarthy Vincent A | $127,900 | -- |
Source: Public Records
Mortgage History
| Date | Status | Borrower | Loan Amount |
|---|---|---|---|
| Previous Owner | Mccarthy Vincent A | $308,836 | |
| Previous Owner | Mccarthy Vincent A | $225,000 | |
| Previous Owner | Mccarthy Vincent A | $161,900 |
Source: Public Records
Tax History
| Year | Tax Paid | Tax Assessment Tax Assessment Total Assessment is a certain percentage of the fair market value that is determined by local assessors to be the total taxable value of land and additions on the property. | Land | Improvement |
|---|---|---|---|---|
| 2025 | $3,590 | $387,700 | $0 | $387,700 |
| 2024 | $3,183 | $349,000 | $0 | $349,000 |
| 2023 | $3,097 | $325,300 | $0 | $325,300 |
| 2022 | $3,079 | $304,900 | $0 | $304,900 |
| 2021 | $2,985 | $284,600 | $0 | $284,600 |
| 2020 | $2,984 | $277,800 | $0 | $277,800 |
| 2019 | $2,776 | $252,100 | $0 | $252,100 |
| 2018 | $2,562 | $223,600 | $0 | $223,600 |
| 2017 | $2,279 | $193,800 | $0 | $193,800 |
| 2016 | $2,181 | $183,000 | $0 | $183,000 |
| 2015 | $2,050 | $166,700 | $0 | $166,700 |
Source: Public Records
Map
Nearby Homes
- 12 Ledgewood Way Unit 8
- 3 Ledgewood Way Unit 8
- 7 Ledgewood Way Unit 8
- 8 Ledgewood Way Unit 20
- 9 Ledgewood Way Unit 6
- 252 Newbury St Unit 1
- 252 Newbury St
- 261 Newbury St Unit 17A
- 165 Newbury St Unit 4
- 286 Newbury St Unit 110
- 161 Newbury St Unit 32
- 14 Raylen Ave
- 437 Lowell St
- 4 Price Rd
- 4 Curwen Rd
- 103 Norris Brook Ln Unit 103
- 47 Collins St Unit 50
- 21 Olsen Rd
- 19 Lindauer St
- 98 Newbury St Unit 18B
- 11 Bourbon St Unit 48
- 11 Bourbon St Unit 47
- 11 Bourbon St Unit 46
- 11 Bourbon St Unit 45
- 11 Bourbon St Unit 44
- 11 Bourbon St Unit 43
- 11 Bourbon St Unit 41
- 11 Bourbon St Unit 40
- 11 Bourbon St Unit 39
- 11 Bourbon St Unit 38
- 11 Bourbon St Unit 37
- 11 Bourbon St Unit 11-42
- 11 Bourbon St Unit 38,11
- 11 Bourbon St Unit 47 11
- 15-63 Urbon St Unit 63-15
- 13 Bourbon St Unit 60
- 13 Bourbon St Unit 59
- 13 Bourbon St Unit 58
- 13 Bourbon St Unit 57
- 13 Bourbon St Unit 56
Your Personal Tour Guide
Ask me questions while you tour the home.