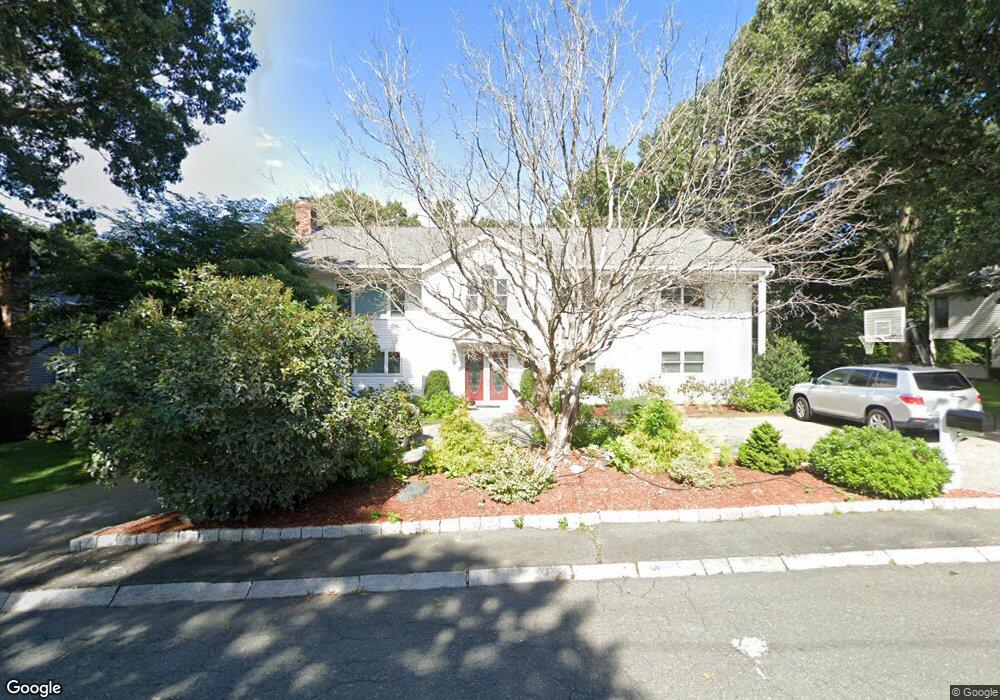
11 Bradford Rd Woburn, MA 01801
Downtown Woburn NeighborhoodEstimated Value: $1,150,761 - $1,453,000
5
Beds
4
Baths
4,128
Sq Ft
$320/Sq Ft
Est. Value
About This Home
This home is located at 11 Bradford Rd, Woburn, MA 01801 and is currently estimated at $1,322,440, approximately $320 per square foot. 11 Bradford Rd is a home located in Middlesex County with nearby schools including Shamrock Elementary School, Daniel L. Joyce Middle School, and Woburn High School.
Ownership History
Date
Name
Owned For
Owner Type
Purchase Details
Closed on
Jan 5, 1999
Sold by
Lishner Rosemarie and Petruzello Steven F
Bought by
Turney Paul F and Turney Dianne J
Current Estimated Value
Home Financials for this Owner
Home Financials are based on the most recent Mortgage that was taken out on this home.
Original Mortgage
$227,000
Interest Rate
6.84%
Mortgage Type
Purchase Money Mortgage
Create a Home Valuation Report for This Property
The Home Valuation Report is an in-depth analysis detailing your home's value as well as a comparison with similar homes in the area
Home Values in the Area
Average Home Value in this Area
Purchase History
| Date | Buyer | Sale Price | Title Company |
|---|---|---|---|
| Turney Paul F | $333,900 | -- |
Source: Public Records
Mortgage History
| Date | Status | Borrower | Loan Amount |
|---|---|---|---|
| Open | Turney Paul F | $190,000 | |
| Closed | Turney Paul F | $227,000 | |
| Previous Owner | Turney Paul F | $178,255 |
Source: Public Records
Tax History Compared to Growth
Tax History
| Year | Tax Paid | Tax Assessment Tax Assessment Total Assessment is a certain percentage of the fair market value that is determined by local assessors to be the total taxable value of land and additions on the property. | Land | Improvement |
|---|---|---|---|---|
| 2025 | $8,910 | $1,043,300 | $369,000 | $674,300 |
| 2024 | $8,268 | $1,025,800 | $351,500 | $674,300 |
| 2023 | $7,981 | $917,300 | $319,500 | $597,800 |
| 2022 | $7,751 | $829,900 | $278,000 | $551,900 |
| 2021 | $7,646 | $819,500 | $264,800 | $554,700 |
| 2020 | $7,310 | $784,300 | $264,800 | $519,500 |
| 2019 | $6,956 | $732,200 | $252,200 | $480,000 |
| 2018 | $6,727 | $680,200 | $231,500 | $448,700 |
| 2017 | $6,488 | $652,700 | $220,500 | $432,200 |
| 2016 | $6,285 | $625,400 | $206,200 | $419,200 |
| 2015 | $6,087 | $598,500 | $192,700 | $405,800 |
| 2014 | $5,266 | $504,400 | $192,700 | $311,700 |
Source: Public Records
Map
Nearby Homes
- 61 Mount Pleasant St
- 27 Blueberry Hill Rd
- 2 George Rd Unit 2
- 64 Garfield Ave
- 12 Spring Ct
- 69 Eastern Ave
- 380 Cross St
- 14 Cross St
- 39 Garfield Ave
- 7 Conant Rd Unit 20
- 44 Main St
- 51 Vernon St
- 171 Swanton St Unit 5
- 171 Swanton St Unit 73
- 35 Prospect St Unit 204
- 35 Prospect St Unit 215
- 20 Arthur St
- 14 Harvard Street Extension
- 29 Porter St
- 3 Richmond Park Unit 1
- 9 Bradford Rd
- 15 Bradford Rd
- 12 Bradford Rd
- 7 Bradford Rd
- 14 Bradford Rd
- 10 Bradford Rd
- 126 Garfield Ave
- 4 Cliffside Terrace
- 4 Cliffside Terrace
- 17 Bradford Rd
- 5 Bradford Rd
- 16 Bradford Rd
- 18 Bradford Rd
- 122 Garfield Ave
- 3 Bradford Rd
- 6 Bradford Rd
- 13 Blueberry Hill Rd
- 9 Blueberry Hill Rd
- 7 Blueberry Hill Rd
- 130 Garfield Ave