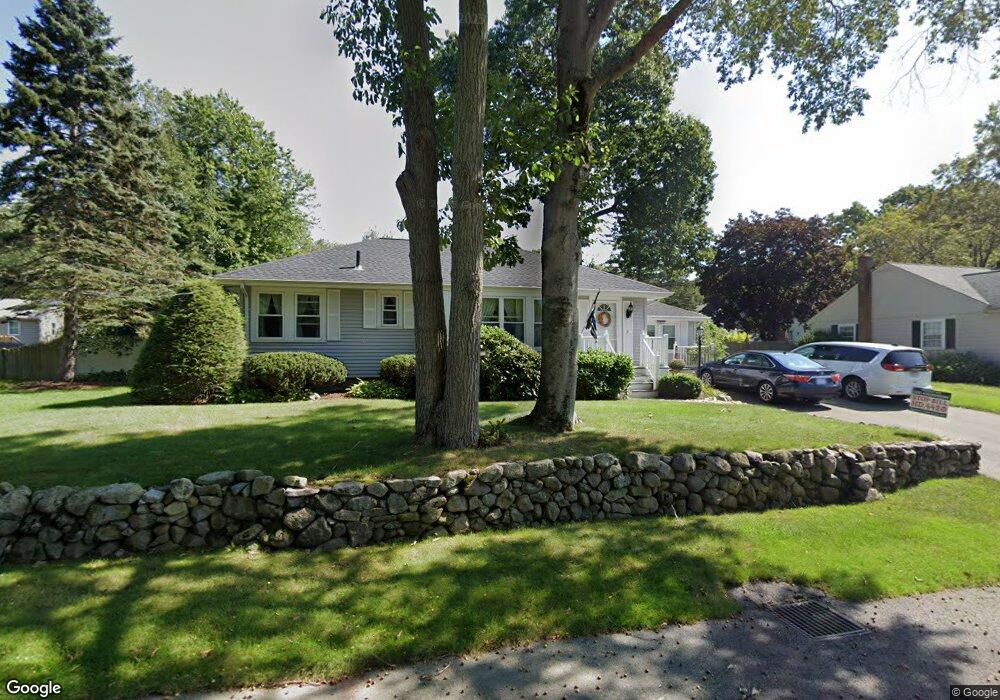
11 Briarwood Rd Holbrook, MA 02343
Estimated Value: $578,942 - $641,000
3
Beds
2
Baths
1,512
Sq Ft
$399/Sq Ft
Est. Value
About This Home
This home is located at 11 Briarwood Rd, Holbrook, MA 02343 and is currently estimated at $602,736, approximately $398 per square foot. 11 Briarwood Rd is a home located in Norfolk County with nearby schools including John F. Kennedy Elementary School, Holbrook Middle High School, and Boston Higashi School.
Ownership History
Date
Name
Owned For
Owner Type
Purchase Details
Closed on
Apr 5, 2021
Sold by
Shanly Mark J
Bought by
Mark Joseph Shanly Sr Lt and Shanly
Current Estimated Value
Purchase Details
Closed on
Nov 3, 1977
Bought by
Shanly Mark J and Shanly Mari-Anne T
Create a Home Valuation Report for This Property
The Home Valuation Report is an in-depth analysis detailing your home's value as well as a comparison with similar homes in the area
Home Values in the Area
Average Home Value in this Area
Purchase History
| Date | Buyer | Sale Price | Title Company |
|---|---|---|---|
| Mark Joseph Shanly Sr Lt | -- | None Available | |
| Mark Joseph Shanly Sr Lt | -- | None Available | |
| Mark Joseph Shanly Sr Lt | -- | None Available | |
| Shanly Mark J | $43,000 | -- |
Source: Public Records
Mortgage History
| Date | Status | Borrower | Loan Amount |
|---|---|---|---|
| Previous Owner | Shanly Mark J | $160,000 | |
| Previous Owner | Shanly Mark J | $160,000 | |
| Previous Owner | Shanly Mark J | $30,000 |
Source: Public Records
Tax History Compared to Growth
Tax History
| Year | Tax Paid | Tax Assessment Tax Assessment Total Assessment is a certain percentage of the fair market value that is determined by local assessors to be the total taxable value of land and additions on the property. | Land | Improvement |
|---|---|---|---|---|
| 2025 | $62 | $468,900 | $229,000 | $239,900 |
| 2024 | $5,992 | $445,800 | $217,300 | $228,500 |
| 2023 | $6,355 | $413,200 | $197,500 | $215,700 |
| 2022 | $5,999 | $363,800 | $179,500 | $184,300 |
| 2021 | $5,898 | $342,500 | $167,800 | $174,700 |
| 2020 | $6,106 | $332,400 | $166,300 | $166,100 |
| 2019 | $6,038 | $310,300 | $153,800 | $156,500 |
| 2018 | $6,060 | $293,200 | $142,400 | $150,800 |
| 2017 | $5,739 | $274,600 | $129,500 | $145,100 |
| 2016 | $5,336 | $271,700 | $129,500 | $142,200 |
| 2015 | $4,953 | $259,600 | $124,500 | $135,100 |
| 2014 | $4,738 | $252,400 | $124,500 | $127,900 |
Source: Public Records
Map
Nearby Homes
- 373 N Franklin St
- 44 Livoli Ave
- 148 N Franklin St
- 1696 Liberty St
- 129 Albee Dr
- 27 Winter St
- 5 Clarendon Cir Unit Lot 4
- 22 Medallion Rd
- 30 Milton Rd
- 7 Drake St
- 152 S Franklin St
- 181 S Franklin St Unit 102
- 181 S Franklin St Unit 207
- 16 Loud Rd
- 56 Woodside Ave
- 360 Plymouth St
- 71 Stevens Dr
- 96 Roberts Ave
- 45-R Ernest St
- 169 Pond St