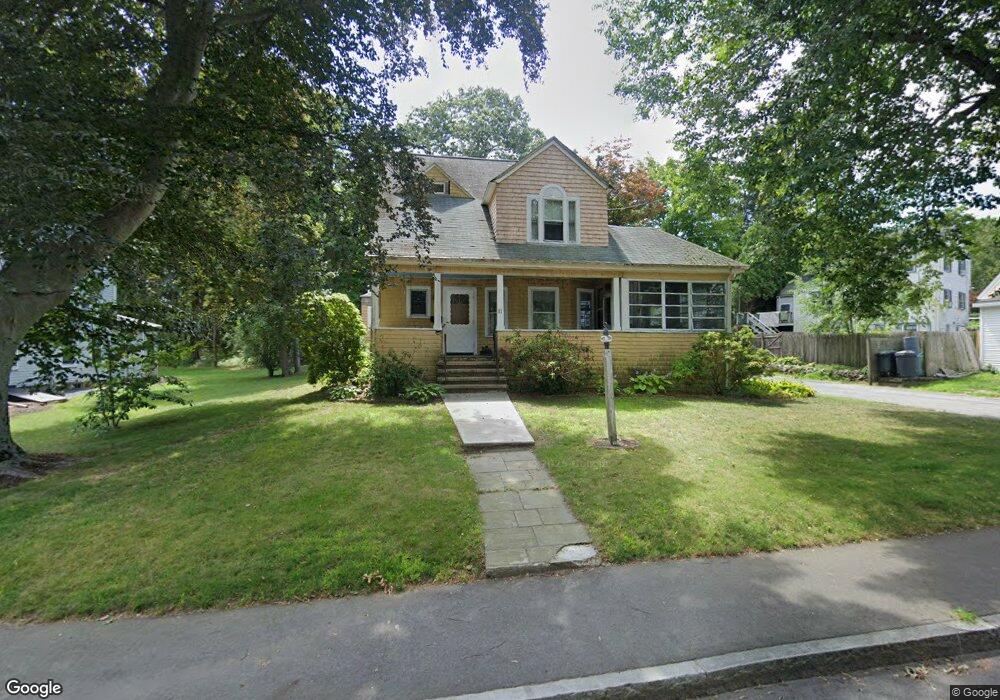
11 Broad St Weymouth, MA 02188
Weymouth Landing NeighborhoodEstimated Value: $603,000 - $744,000
3
Beds
2
Baths
1,750
Sq Ft
$373/Sq Ft
Est. Value
About This Home
This home is located at 11 Broad St, Weymouth, MA 02188 and is currently estimated at $653,414, approximately $373 per square foot. 11 Broad St is a home located in Norfolk County with nearby schools including Frederick C Murphy, Abigail Adams Middle School, and Weymouth Middle School Chapman.
Ownership History
Date
Name
Owned For
Owner Type
Purchase Details
Closed on
Nov 2, 2001
Sold by
Preslar Charlette M
Bought by
Gillis Noreen M
Current Estimated Value
Home Financials for this Owner
Home Financials are based on the most recent Mortgage that was taken out on this home.
Original Mortgage
$200,000
Outstanding Balance
$78,746
Interest Rate
6.82%
Mortgage Type
Purchase Money Mortgage
Estimated Equity
$574,668
Create a Home Valuation Report for This Property
The Home Valuation Report is an in-depth analysis detailing your home's value as well as a comparison with similar homes in the area
Home Values in the Area
Average Home Value in this Area
Purchase History
| Date | Buyer | Sale Price | Title Company |
|---|---|---|---|
| Gillis Noreen M | $270,000 | -- |
Source: Public Records
Mortgage History
| Date | Status | Borrower | Loan Amount |
|---|---|---|---|
| Open | Gillis Noreen M | $200,000 |
Source: Public Records
Tax History Compared to Growth
Tax History
| Year | Tax Paid | Tax Assessment Tax Assessment Total Assessment is a certain percentage of the fair market value that is determined by local assessors to be the total taxable value of land and additions on the property. | Land | Improvement |
|---|---|---|---|---|
| 2025 | $5,161 | $511,000 | $205,800 | $305,200 |
| 2024 | $5,004 | $487,200 | $196,000 | $291,200 |
| 2023 | $4,827 | $461,900 | $181,500 | $280,400 |
| 2022 | $4,712 | $411,200 | $168,100 | $243,100 |
| 2021 | $4,457 | $379,600 | $168,100 | $211,500 |
| 2020 | $4,272 | $358,400 | $168,100 | $190,300 |
| 2019 | $4,169 | $344,000 | $161,600 | $182,400 |
| 2018 | $4,046 | $323,700 | $153,900 | $169,800 |
| 2017 | $3,849 | $300,500 | $146,600 | $153,900 |
| 2016 | $3,699 | $289,000 | $141,000 | $148,000 |
| 2015 | $3,567 | $276,500 | $141,000 | $135,500 |
| 2014 | $3,425 | $257,500 | $131,200 | $126,300 |
Source: Public Records
Map
Nearby Homes
- 15 Summer St
- 16 Lindbergh Ave
- 76 Kingman St
- 23-25 Lindbergh Ave
- 122 Washington St Unit 22
- 11 Richmond St
- 114 Broad St Unit D
- 114 Broad St Unit C
- 36 Brookside Rd
- 19 Vine St Unit 3
- 19 Vine St Unit 1
- 33 Congress St
- 37 Lantern Ln
- 24 Blake Rd
- 141 Commercial St Unit 9
- 51 Faxon St
- 97 Liberty St
- 230 Lisle St
- 294 Commercial St
- 286 Broad St