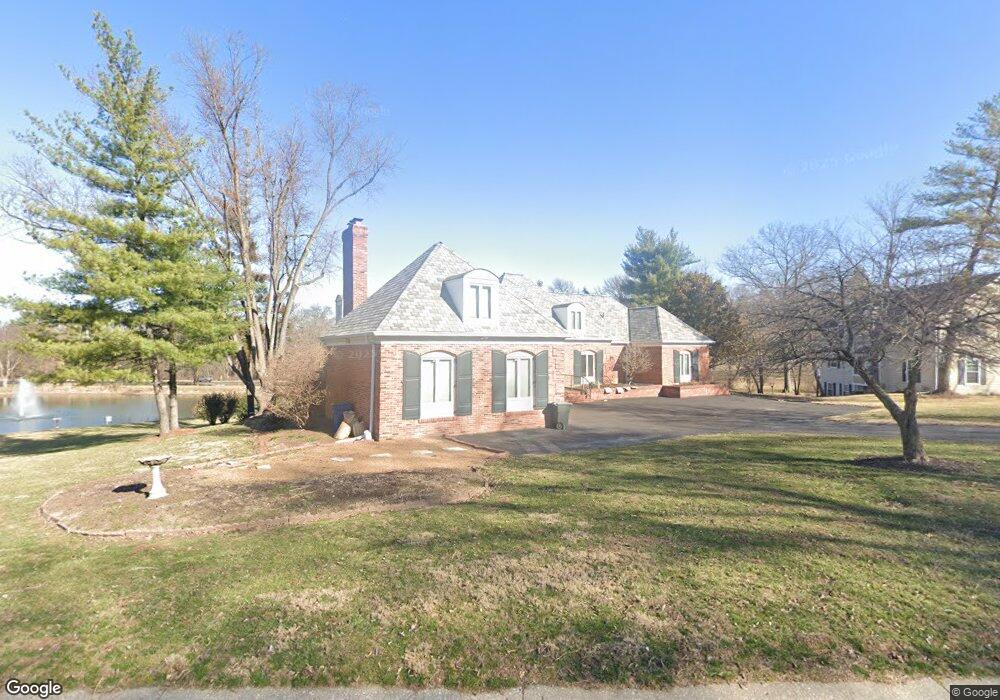
11 Broadview Farm Rd Saint Louis, MO 63141
Estimated Value: $779,000 - $1,563,000
4
Beds
5
Baths
3,671
Sq Ft
$291/Sq Ft
Est. Value
About This Home
This home is located at 11 Broadview Farm Rd, Saint Louis, MO 63141 and is currently estimated at $1,068,659, approximately $291 per square foot. 11 Broadview Farm Rd is a home located in St. Louis County with nearby schools including Mason Ridge Elementary School, Parkway Central Middle School, and Parkway Central High School.
Ownership History
Date
Name
Owned For
Owner Type
Purchase Details
Closed on
Sep 19, 2014
Sold by
Wehking Matthew and Wehking Rhonda L
Bought by
Wehking Family Revocable Trust
Current Estimated Value
Purchase Details
Closed on
Jan 27, 2003
Sold by
Kuhlmann Eric A
Bought by
Mulcahy Randall L and Mulcahy Cecilia
Home Financials for this Owner
Home Financials are based on the most recent Mortgage that was taken out on this home.
Original Mortgage
$322,700
Interest Rate
6%
Purchase Details
Closed on
Jan 15, 2003
Sold by
Ashton Robert James Harold and Ashton Pauline E
Bought by
Wehking Matthew and Wehking Rhonda L
Home Financials for this Owner
Home Financials are based on the most recent Mortgage that was taken out on this home.
Original Mortgage
$322,700
Interest Rate
6%
Purchase Details
Closed on
Oct 24, 2002
Sold by
Advanced Automotive Inc
Bought by
City Of Maplewood Missouri
Create a Home Valuation Report for This Property
The Home Valuation Report is an in-depth analysis detailing your home's value as well as a comparison with similar homes in the area
Home Values in the Area
Average Home Value in this Area
Purchase History
| Date | Buyer | Sale Price | Title Company |
|---|---|---|---|
| Wehking Family Revocable Trust | -- | None Available | |
| Mulcahy Randall L | -- | -- | |
| Wehking Matthew | $560,000 | -- | |
| City Of Maplewood Missouri | -- | -- |
Source: Public Records
Mortgage History
| Date | Status | Borrower | Loan Amount |
|---|---|---|---|
| Previous Owner | Wehking Matthew | $322,700 | |
| Closed | Wehking Matthew | $60,000 |
Source: Public Records
Tax History Compared to Growth
Tax History
| Year | Tax Paid | Tax Assessment Tax Assessment Total Assessment is a certain percentage of the fair market value that is determined by local assessors to be the total taxable value of land and additions on the property. | Land | Improvement |
|---|---|---|---|---|
| 2025 | $10,260 | $166,150 | $61,120 | $105,030 |
| 2024 | $10,260 | $153,920 | $61,120 | $92,800 |
| 2023 | $10,260 | $153,920 | $61,120 | $92,800 |
| 2022 | $10,174 | $141,140 | $53,450 | $87,690 |
| 2021 | $10,083 | $141,140 | $53,450 | $87,690 |
| 2020 | $9,888 | $132,020 | $53,450 | $78,570 |
| 2019 | $9,734 | $132,020 | $53,450 | $78,570 |
| 2018 | $9,599 | $120,270 | $39,770 | $80,500 |
| 2017 | $9,507 | $120,270 | $39,770 | $80,500 |
| 2016 | $9,636 | $117,160 | $39,770 | $77,390 |
| 2015 | $10,050 | $117,160 | $39,770 | $77,390 |
| 2014 | $8,492 | $105,830 | $45,750 | $60,080 |
Source: Public Records
Map
Nearby Homes
- 12875 Conway Rd
- 10 Ridgecreek Rd
- 390 Pebble Valley Dr
- 350 S Mason Rd
- 415 Killearn Ln
- 13250 Pinetree Lake Dr
- 13256 Pebble Ridge Dr
- 13321 Tree Top View Ct
- 8 Chasselle Ln
- 353 Conway Gardens Ct
- 327 Chasselle Ln
- 12410 Montsouris Dr
- 11 Roclare Ln
- 12311 Gaillard Dr
- 12204 Ladue Rd
- 8 Balcon Estates
- 485 Meadow Green Place
- 1047 Tidewater Place Ct
- 1126 Corrington Ct
- 29 Muirfield Ln
- 10 Broadview Farm Rd
- 14 Broadview Farm Rd
- 15 Broadview Farm Rd
- 16 Broadview Farm Rd
- 9 Broadview Farm Rd
- 17 Broadview Farm Rd
- 26 Broadview Farm Rd
- 25 Broadview Farm Rd
- 13010 Conway Estates Dr
- 27 Broadview Farm Rd
- 1 Broadview Farm Rd
- 13016 Conway Estates Dr
- 24 Broadview Farm Rd
- 425 S Mason Rd
- 412 S Mason Rd
- 13004 Conway Estates Dr
- 3 Broadview Farm Rd
- 13101 Conway Grove Ln
- 4 Broadview Farm Rd
- 312 Wyndmoor Terrace Ct