11 Brogden Rd Ashland, MA 01721
Estimated Value: $1,119,000 - $1,244,000
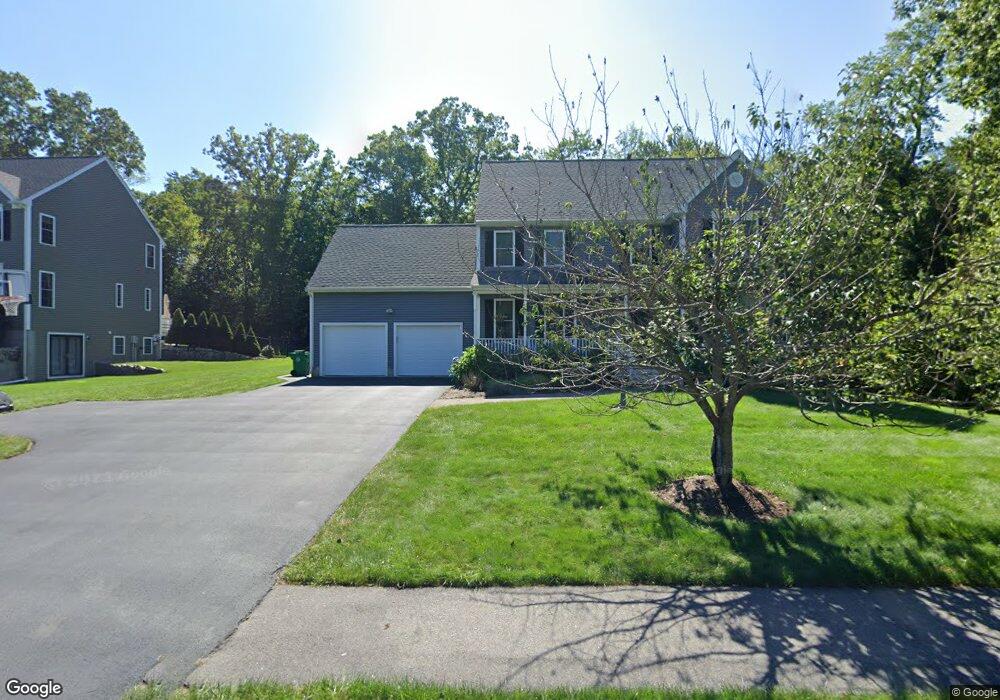
About This Home
This home is located at 11 Brogden Rd, Ashland, MA 01721 and is currently estimated at $1,181,354, approximately $522 per square foot. 11 Brogden Rd is a home located in Middlesex County with nearby schools including William Pittaway Elementary School, David Mindess Elementary School, and Henry E. Warren Elementary School.
Ownership History
We collect this data history from publicly available records. To have your information removed, we recommend requesting removal directly through your county’s website.
Purchase Details
Home Financials for this Owner
Home Financials are based on the most recent Mortgage that was taken out on this home.Home Values in the Area
Average Home Value in this Area
Purchase History
We collect this data history from publicly available records. To have your information removed, we recommend requesting removal directly through your county’s website.
| Date | Buyer | Sale Price | Title Company |
|---|---|---|---|
| $550,000 | -- | ||
| $95,000 | -- |
Mortgage History
We collect this data history from publicly available records. To have your information removed, we recommend requesting removal directly through your county’s website.
| Date | Status | Borrower | Loan Amount |
|---|---|---|---|
| Open | $350,000 |
Tax History
We collect this data history from publicly available records. To have your information removed, we recommend requesting removal directly through your county’s website.
| Year | Tax Paid | Tax Assessment Tax Assessment Total Assessment is a certain percentage of the fair market value that is determined by local assessors to be the total taxable value of land and additions on the property. | Land | Improvement |
|---|---|---|---|---|
| 2025 | $12,949 | $1,014,000 | $291,100 | $722,900 |
| 2024 | $12,334 | $931,600 | $291,100 | $640,500 |
| 2023 | $11,308 | $821,200 | $277,000 | $544,200 |
| 2022 | $11,402 | $718,000 | $251,900 | $466,100 |
| 2021 | $10,888 | $683,500 | $251,900 | $431,600 |
| 2020 | $10,303 | $668,300 | $256,200 | $412,100 |
| 2019 | $10,645 | $653,900 | $256,200 | $397,700 |
| 2018 | $10,416 | $627,100 | $252,500 | $374,600 |
| 2017 | $10,242 | $613,300 | $251,400 | $361,900 |
| 2016 | $10,151 | $597,100 | $251,400 | $345,700 |
| 2015 | $10,205 | $589,900 | $240,000 | $349,900 |
| 2014 | $9,563 | $549,900 | $222,900 | $327,000 |
Map
- 82 Hardwick Rd
- 69 Spruce St Unit 69
- 4 Indian Brook Rd
- 35 Orchard Rd
- 28 Waterville Ln Unit 28
- 9 Waterville Ln Unit 9
- 2 Poplar Ln Unit 2
- 30 Magnolia Dr Unit 30
- 24 Cherry Ln Unit 24
- 61 Aspen Way Unit 61
- 27 Heritage Ave
- 164 E Main St
- 75 Wilson St
- 9 Olive St
- 84 W Union St
- 15 Haven Way
- 62 W Union St
- 18 Haven Way
- 73 Sudbury Rd
- 58 Cedar Hill Rd
Ask me questions while you tour the home.