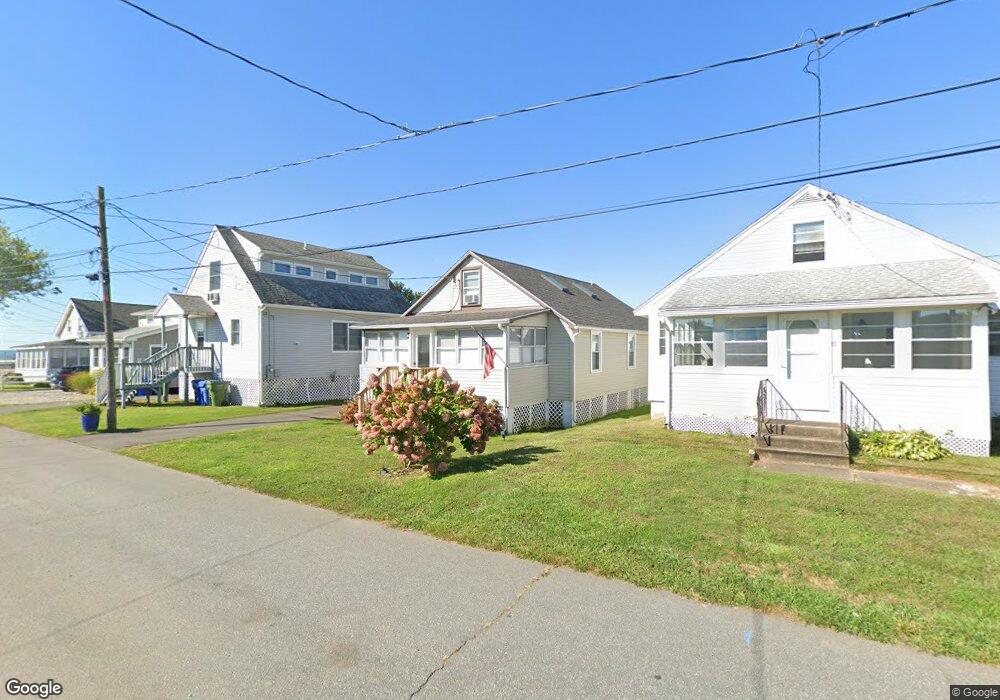
11 Brook St Old Saybrook, CT 06475
Estimated Value: $555,000 - $621,441
5
Beds
1
Bath
996
Sq Ft
$591/Sq Ft
Est. Value
About This Home
This home is located at 11 Brook St, Old Saybrook, CT 06475 and is currently estimated at $588,360, approximately $590 per square foot. 11 Brook St is a home located in Middlesex County with nearby schools including Kathleen E. Goodwin School, Old Saybrook Middle School, and Old Saybrook Senior High School.
Ownership History
Date
Name
Owned For
Owner Type
Purchase Details
Closed on
Jul 20, 2020
Sold by
Pascucci George C and Pascucci Peggy J
Bought by
Pascual Matthew P and Pascual Laura R
Current Estimated Value
Home Financials for this Owner
Home Financials are based on the most recent Mortgage that was taken out on this home.
Original Mortgage
$308,250
Outstanding Balance
$273,336
Interest Rate
3.1%
Mortgage Type
Purchase Money Mortgage
Estimated Equity
$315,024
Purchase Details
Closed on
Jul 8, 2016
Sold by
Pascucci George C
Bought by
Pascucci Peggy J
Create a Home Valuation Report for This Property
The Home Valuation Report is an in-depth analysis detailing your home's value as well as a comparison with similar homes in the area
Home Values in the Area
Average Home Value in this Area
Purchase History
| Date | Buyer | Sale Price | Title Company |
|---|---|---|---|
| Pascual Matthew P | $342,500 | None Available | |
| Pascucci Peggy J | -- | -- |
Source: Public Records
Mortgage History
| Date | Status | Borrower | Loan Amount |
|---|---|---|---|
| Open | Pascual Matthew P | $308,250 | |
| Previous Owner | Pascucci Peggy J | $100,000 |
Source: Public Records
Tax History Compared to Growth
Tax History
| Year | Tax Paid | Tax Assessment Tax Assessment Total Assessment is a certain percentage of the fair market value that is determined by local assessors to be the total taxable value of land and additions on the property. | Land | Improvement |
|---|---|---|---|---|
| 2025 | $5,168 | $333,400 | $217,500 | $115,900 |
| 2024 | $5,068 | $333,400 | $217,500 | $115,900 |
| 2023 | $3,924 | $191,900 | $142,500 | $49,400 |
| 2022 | $3,853 | $191,900 | $142,500 | $49,400 |
| 2021 | $3,848 | $191,900 | $142,500 | $49,400 |
| 2020 | $3,848 | $191,900 | $142,500 | $49,400 |
| 2019 | $3,790 | $191,900 | $142,500 | $49,400 |
| 2018 | $3,322 | $169,500 | $105,400 | $64,100 |
| 2017 | $3,332 | $169,500 | $105,400 | $64,100 |
| 2016 | $3,265 | $169,500 | $105,400 | $64,100 |
| 2015 | $3,188 | $169,500 | $105,400 | $64,100 |
| 2014 | $3,136 | $169,500 | $105,400 | $64,100 |
Source: Public Records
Map
Nearby Homes
- 133 Sandy Point Rd Unit 133
- 143 Sandy Point Rd Unit 143
- 118 Sandy Point Rd
- 96 Chalker Beach Rd
- 254 Hidden Cove Rd
- 1 Clark Ave
- 14 Denmore Ln
- 174 Nehantic Trail
- 26 Meadowood Ln
- 83 Sagamore Terrace E
- 17 Woodsedge Ln
- 78 Hartford Ave
- 122 Old Post Rd
- 4 Sea View Ave
- 48 Great Hammock Rd
- 7 Sharon Ln
- 21 Farview Ave
- 1469 Boston Post Rd Unit 19
- 60 Ingham Hill Rd
- 155 Fawn Hill Dr