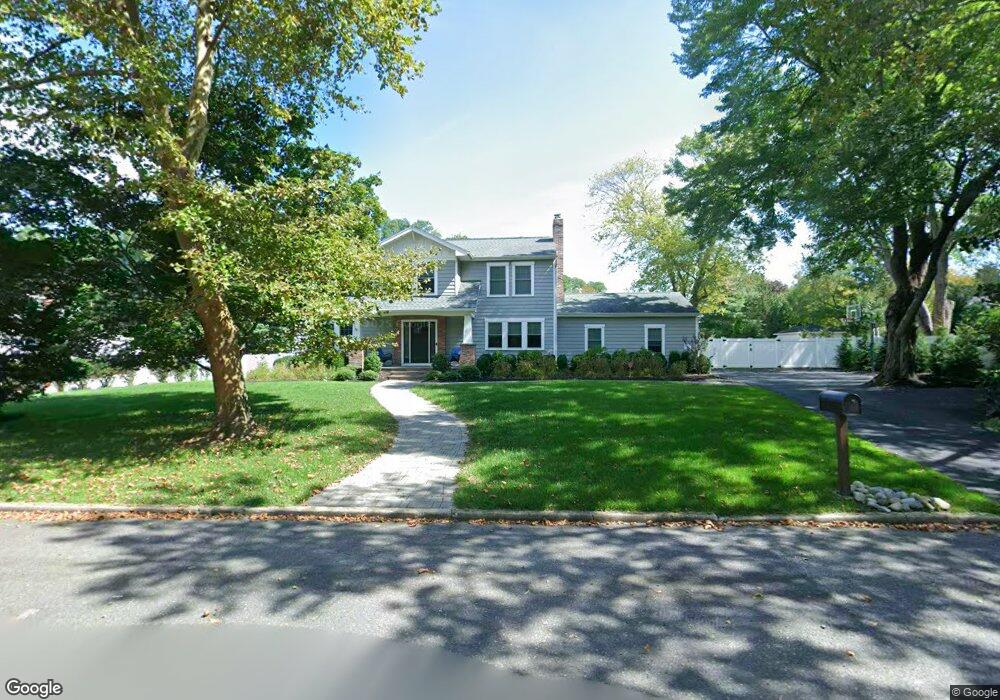
11 Brook St Tinton Falls, NJ 07712
Estimated Value: $851,000 - $1,007,000
4
Beds
3
Baths
2,916
Sq Ft
$327/Sq Ft
Est. Value
About This Home
This home is located at 11 Brook St, Tinton Falls, NJ 07712 and is currently estimated at $954,002, approximately $327 per square foot. 11 Brook St is a home located in Monmouth County with nearby schools including Mahala F. Atchinson Elementary School, Swimming River Elementary School, and Tinton Falls Middle School.
Ownership History
Date
Name
Owned For
Owner Type
Purchase Details
Closed on
Nov 2, 2016
Sold by
Williams Thomas
Bought by
Williams Cynthia A and Williams Thomas
Current Estimated Value
Home Financials for this Owner
Home Financials are based on the most recent Mortgage that was taken out on this home.
Interest Rate
3.47%
Purchase Details
Closed on
Aug 30, 2000
Sold by
Stambler Harvey
Bought by
Bado Robert
Home Financials for this Owner
Home Financials are based on the most recent Mortgage that was taken out on this home.
Original Mortgage
$252,600
Interest Rate
8.16%
Create a Home Valuation Report for This Property
The Home Valuation Report is an in-depth analysis detailing your home's value as well as a comparison with similar homes in the area
Home Values in the Area
Average Home Value in this Area
Purchase History
| Date | Buyer | Sale Price | Title Company |
|---|---|---|---|
| Williams Cynthia A | -- | -- | |
| Bado Robert | $397,000 | -- |
Source: Public Records
Mortgage History
| Date | Status | Borrower | Loan Amount |
|---|---|---|---|
| Closed | Williams Cynthia A | -- | |
| Previous Owner | Bado Robert | $252,600 |
Source: Public Records
Tax History Compared to Growth
Tax History
| Year | Tax Paid | Tax Assessment Tax Assessment Total Assessment is a certain percentage of the fair market value that is determined by local assessors to be the total taxable value of land and additions on the property. | Land | Improvement |
|---|---|---|---|---|
| 2025 | $11,988 | $857,400 | $332,400 | $525,000 |
| 2024 | $12,126 | $833,100 | $315,300 | $517,800 |
| 2023 | $12,126 | $794,600 | $291,300 | $503,300 |
| 2022 | $11,404 | $674,400 | $273,100 | $401,300 |
| 2021 | $11,107 | $592,100 | $255,000 | $337,100 |
| 2020 | $11,300 | $566,400 | $236,900 | $329,500 |
| 2019 | $11,107 | $557,600 | $230,000 | $327,600 |
| 2018 | $10,699 | $535,500 | $223,100 | $312,400 |
| 2017 | $10,292 | $502,300 | $193,100 | $309,200 |
| 2016 | $8,047 | $383,900 | $193,100 | $190,800 |
| 2015 | $7,845 | $379,000 | $193,100 | $185,900 |
| 2014 | $7,769 | $359,000 | $174,400 | $184,600 |
Source: Public Records
Map
Nearby Homes
- 102 Rolling Meadows Blvd S
- 106 Rolling Meadows Blvd S
- 62 Rolling Meadows Blvd S
- 11 Rolling Meadows Blvd S
- 16 Rolling Meadows Blvd S
- 4 Magnolia Ct
- 41 Rolling Meadows Blvd S
- 1218 W Park Ave
- 21 Walter Ave
- 2 Pelican Ct
- 139 Tanya Cir Unit 5506
- 74 Kyle Dr
- 44 Charles Ct
- 14 Copperfield Ct
- 22 Jake Dr
- 18 Kyle Dr
- 11 Madison Ct
- 2 Madison Ct
- 43 Richmond Ct
- 46 Fredric Dr