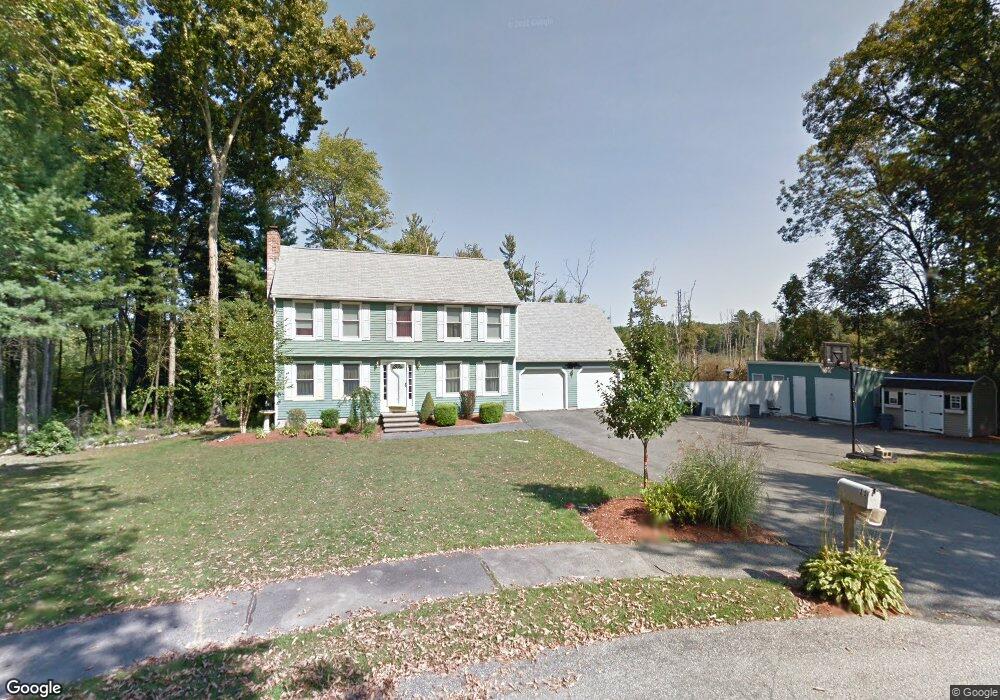
11 Brookside Ct Methuen, MA 01844
The North End NeighborhoodEstimated Value: $705,000 - $801,000
3
Beds
3
Baths
2,051
Sq Ft
$375/Sq Ft
Est. Value
About This Home
This home is located at 11 Brookside Ct, Methuen, MA 01844 and is currently estimated at $768,373, approximately $374 per square foot. 11 Brookside Ct is a home located in Essex County with nearby schools including Methuen High School and The Birches Academy of Academics and Art.
Ownership History
Date
Name
Owned For
Owner Type
Purchase Details
Closed on
Oct 14, 2025
Sold by
Aguilo Ana M and Escobar Jose
Bought by
Brookside Court Llc
Current Estimated Value
Home Financials for this Owner
Home Financials are based on the most recent Mortgage that was taken out on this home.
Original Mortgage
$344,500
Outstanding Balance
$344,500
Interest Rate
6.5%
Mortgage Type
Commercial
Estimated Equity
$423,873
Purchase Details
Closed on
Oct 2, 2019
Sold by
Reyes Oasis
Bought by
Moore Aileen
Purchase Details
Closed on
Apr 21, 2011
Sold by
Reyes Manuel E
Bought by
Reyes Manuel E and Reyes Oasis
Purchase Details
Closed on
Jul 23, 2010
Sold by
Norton Peter F and Norton Lisa N
Bought by
Reyes Manuel E and Norton Peter F
Home Financials for this Owner
Home Financials are based on the most recent Mortgage that was taken out on this home.
Original Mortgage
$345,349
Interest Rate
4.76%
Mortgage Type
Purchase Money Mortgage
Create a Home Valuation Report for This Property
The Home Valuation Report is an in-depth analysis detailing your home's value as well as a comparison with similar homes in the area
Home Values in the Area
Average Home Value in this Area
Purchase History
| Date | Buyer | Sale Price | Title Company |
|---|---|---|---|
| Brookside Court Llc | -- | -- | |
| Moore Aileen | -- | None Available | |
| Reyes Manuel E | -- | -- | |
| Reyes Manuel E | -- | -- | |
| Reyes Manuel E | $350,000 | -- | |
| Reyes Manuel E | $350,000 | -- |
Source: Public Records
Mortgage History
| Date | Status | Borrower | Loan Amount |
|---|---|---|---|
| Open | Brookside Court Llc | $344,500 | |
| Previous Owner | Reyes Manuel E | $345,349 | |
| Previous Owner | Reyes Manuel E | $170,000 | |
| Previous Owner | Reyes Manuel E | $145,500 |
Source: Public Records
Tax History
| Year | Tax Paid | Tax Assessment Tax Assessment Total Assessment is a certain percentage of the fair market value that is determined by local assessors to be the total taxable value of land and additions on the property. | Land | Improvement |
|---|---|---|---|---|
| 2025 | $6,474 | $611,900 | $281,900 | $330,000 |
| 2024 | $6,314 | $581,400 | $248,300 | $333,100 |
| 2023 | $6,075 | $519,200 | $220,000 | $299,200 |
| 2022 | $5,884 | $450,900 | $192,000 | $258,900 |
| 2021 | $5,569 | $422,200 | $182,700 | $239,500 |
| 2020 | $5,544 | $412,500 | $182,700 | $229,800 |
| 2019 | $5,500 | $387,600 | $173,400 | $214,200 |
| 2018 | $5,391 | $377,800 | $173,400 | $204,400 |
| 2017 | $5,290 | $361,100 | $173,400 | $187,700 |
| 2016 | $5,299 | $357,800 | $173,400 | $184,400 |
| 2015 | $5,126 | $351,100 | $173,400 | $177,700 |
Source: Public Records
Map
Nearby Homes
- 48 Butler St
- 139 North St
- 10 Evelyn Rd
- 8 Cole St
- 20 Williams St
- 9 Clydesdale Rd
- 117 Lawrence Rd
- 4 Mulberry Rd
- 27 Mary Lou St
- 40 Stanwood Rd Unit 9
- 7 Tree Top Way
- 3 Adams Ave
- 159-161 Howe St
- 47 Bailey Ct
- 55 Phoebe St Unit 32
- 74 Ayers Village Rd
- 12 Braemoor Woods Rd Unit 206
- 1513 Broadway
- 5 Sally Sweets Way Unit 110
- 5 Sally Sweets Way Unit 128
Your Personal Tour Guide
Ask me questions while you tour the home.