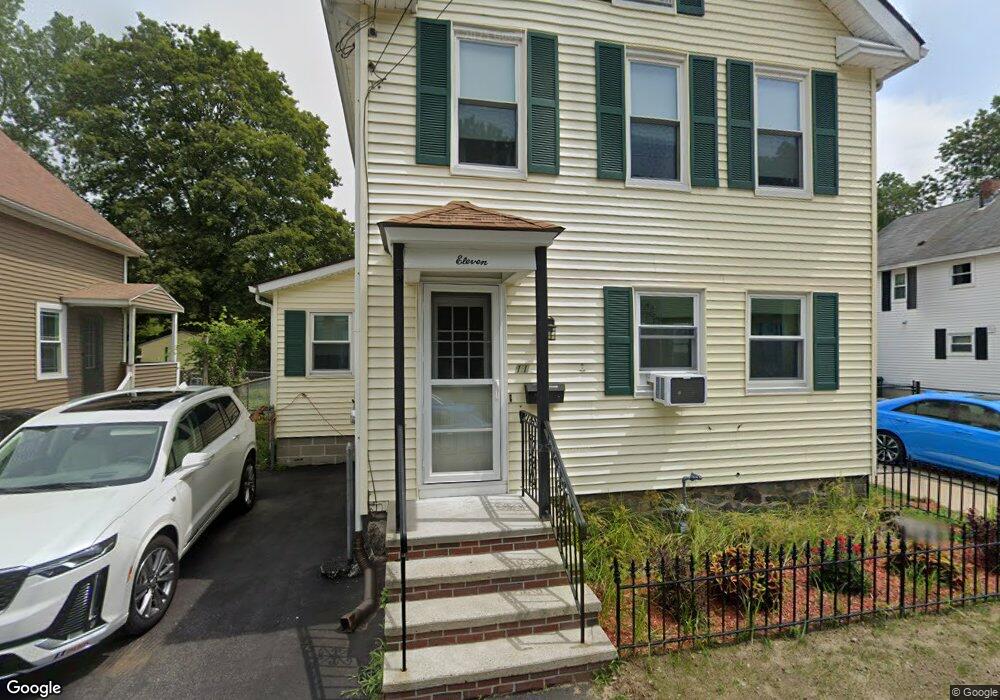
11 Brown Ct Methuen, MA 01844
Downtown Methuen NeighborhoodEstimated Value: $548,000 - $564,863
2
Beds
2
Baths
1,837
Sq Ft
$302/Sq Ft
Est. Value
About This Home
This home is located at 11 Brown Ct, Methuen, MA 01844 and is currently estimated at $555,466, approximately $302 per square foot. 11 Brown Ct is a home located in Essex County with nearby schools including Marsh Grammar School, South Point Elementary School, and Methuen High School.
Ownership History
Date
Name
Owned For
Owner Type
Purchase Details
Closed on
Feb 24, 2023
Sold by
Holmes James F and Holmes Sandra L
Bought by
Holmes James F and Holmes Sandra L
Current Estimated Value
Home Financials for this Owner
Home Financials are based on the most recent Mortgage that was taken out on this home.
Original Mortgage
$383,000
Outstanding Balance
$368,587
Interest Rate
5.5%
Mortgage Type
Adjustable Rate Mortgage/ARM
Estimated Equity
$186,879
Purchase Details
Closed on
Jul 1, 1998
Sold by
Mukerjee Joanne H
Bought by
Holmes James F
Purchase Details
Closed on
Jan 8, 1993
Sold by
Fhlmc
Bought by
Mukerjee Joanne H
Purchase Details
Closed on
Apr 22, 1987
Sold by
Jutras David J
Bought by
Proctor Robert
Create a Home Valuation Report for This Property
The Home Valuation Report is an in-depth analysis detailing your home's value as well as a comparison with similar homes in the area
Home Values in the Area
Average Home Value in this Area
Purchase History
| Date | Buyer | Sale Price | Title Company |
|---|---|---|---|
| Holmes James F | -- | None Available | |
| Holmes James F | -- | None Available | |
| Holmes James F | -- | None Available | |
| Holmes James F | $132,000 | -- | |
| Mukerjee Joanne H | $46,000 | -- | |
| Holmes James F | $132,000 | -- | |
| Mukerjee Joanne H | $46,000 | -- | |
| Proctor Robert | $145,000 | -- |
Source: Public Records
Mortgage History
| Date | Status | Borrower | Loan Amount |
|---|---|---|---|
| Open | Holmes James F | $383,000 | |
| Closed | Holmes James F | $383,000 | |
| Previous Owner | Proctor Robert | $213,000 |
Source: Public Records
Tax History Compared to Growth
Tax History
| Year | Tax Paid | Tax Assessment Tax Assessment Total Assessment is a certain percentage of the fair market value that is determined by local assessors to be the total taxable value of land and additions on the property. | Land | Improvement |
|---|---|---|---|---|
| 2025 | $5,014 | $473,900 | $202,700 | $271,200 |
| 2024 | $4,879 | $449,300 | $184,900 | $264,400 |
| 2023 | $4,712 | $402,700 | $164,400 | $238,300 |
| 2022 | $4,359 | $334,000 | $130,100 | $203,900 |
| 2021 | $4,098 | $310,700 | $123,300 | $187,400 |
| 2020 | $4,064 | $302,400 | $123,300 | $179,100 |
| 2019 | $3,962 | $279,200 | $116,400 | $162,800 |
| 2018 | $3,770 | $264,200 | $109,600 | $154,600 |
| 2017 | $3,670 | $250,500 | $109,600 | $140,900 |
| 2016 | $3,466 | $234,000 | $95,900 | $138,100 |
| 2015 | $3,336 | $228,500 | $95,900 | $132,600 |
Source: Public Records
Map
Nearby Homes
- 47 Lowell St
- 83 Arnold St
- 26 Gage St
- 190-192 Oakland Ave
- 52 High St Unit 5
- 17-19 Maplewood Ave
- 20-22 Ashland Ave
- 37 Maplewood Ave
- 24 Railroad St
- 4 Capitol St
- 2 Horne St
- 35 Hardy St
- 21 Hampshire Rd Unit 412
- 23 Chase St
- 19 Hampshire Rd Unit 304
- 100-102 Phillips St
- 23 Hampshire Rd Unit 404
- 69 Broadway
- 0 Hampshire Rd
- 220 Pelham St
- 13 Bentley Cir
- 79 Brown Ct
- 79 Brown Ct Unit 2
- 7-9 Brown Ct
- 7 Brown Ct
- 15 Bentley Cir
- 12 Brown Ct
- 9 Bentley Cir
- 11 Bentley Cir
- 10 Brown Ct
- 10 Brown Ct Unit 1
- 10 Brown Ct Unit 10
- 24 Brown Ct
- 19 Bentley Cir
- 21 Bentley Cir
- 19 Bentley Cir Unit 4
- 8 Brown Ct
- 30 Brown Ct Unit 32
- 5 Bentley Cir
- 5 Bentley Cir Unit 5