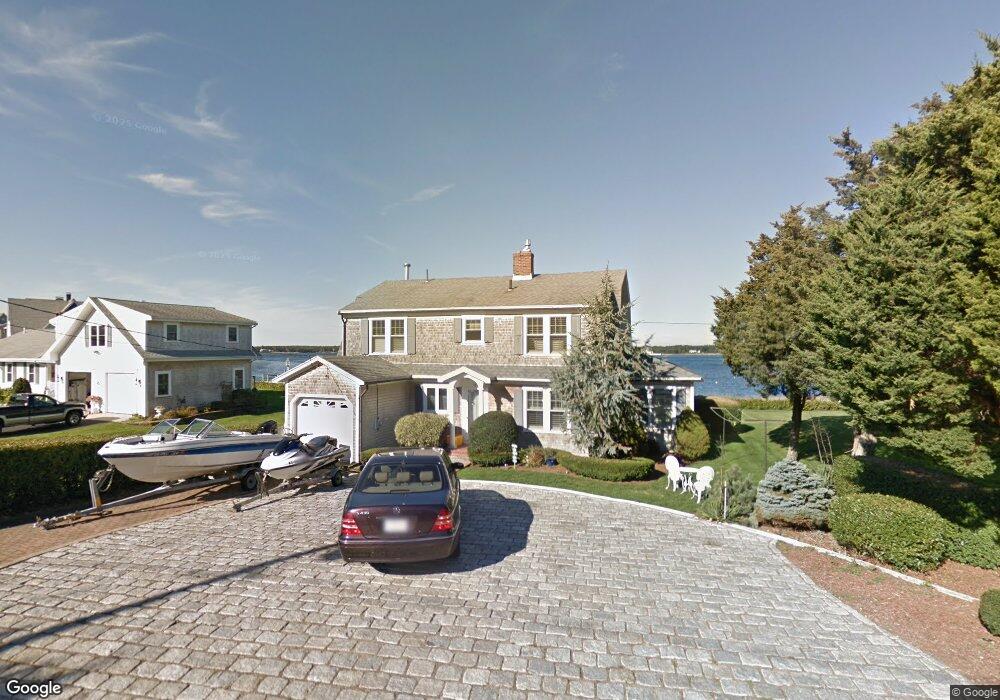
11 Bryant Rd Bourne, MA 2532
Estimated Value: $1,517,000 - $1,828,000
3
Beds
2
Baths
2,064
Sq Ft
$787/Sq Ft
Est. Value
About This Home
This home is located at 11 Bryant Rd, Bourne, MA 2532 and is currently estimated at $1,623,706, approximately $786 per square foot. 11 Bryant Rd is a home located in Barnstable County with nearby schools including Bourne High School, St Margaret Regional School, and Cadence Academy Preschool - Bourne.
Ownership History
Date
Name
Owned For
Owner Type
Purchase Details
Closed on
May 1, 2025
Sold by
11 Bryant Road Llc
Bought by
Fl Llc Devellis Prop Llc
Current Estimated Value
Purchase Details
Closed on
Apr 10, 2024
Sold by
Leung Susan D and Leung Bertarelli-Webb D
Bought by
11 Bryant Road Llc
Purchase Details
Closed on
Jul 6, 2017
Sold by
Bertarelli James W
Bought by
Bertarelli Matthew and Bertarelli Daniel
Purchase Details
Closed on
Aug 24, 1990
Sold by
Est Rosen Rosalie
Bought by
Webber Wayne N
Home Financials for this Owner
Home Financials are based on the most recent Mortgage that was taken out on this home.
Original Mortgage
$187,000
Interest Rate
10.01%
Mortgage Type
Purchase Money Mortgage
Create a Home Valuation Report for This Property
The Home Valuation Report is an in-depth analysis detailing your home's value as well as a comparison with similar homes in the area
Home Values in the Area
Average Home Value in this Area
Purchase History
| Date | Buyer | Sale Price | Title Company |
|---|---|---|---|
| Fl Llc Devellis Prop Llc | -- | None Available | |
| Fl Llc Devellis Prop Llc | -- | None Available | |
| 11 Bryant Road Llc | $1,700,000 | None Available | |
| 11 Bryant Road Llc | $1,700,000 | None Available | |
| 11 Bryant Road Llc | $1,700,000 | None Available | |
| Bertarelli Matthew | -- | -- | |
| Bertarelli Matthew | -- | -- | |
| Bertarelli Matthew | -- | -- | |
| Webber Wayne N | $317,500 | -- | |
| Webber Wayne N | $317,500 | -- |
Source: Public Records
Mortgage History
| Date | Status | Borrower | Loan Amount |
|---|---|---|---|
| Previous Owner | Webber Wayne N | $187,000 |
Source: Public Records
Tax History Compared to Growth
Tax History
| Year | Tax Paid | Tax Assessment Tax Assessment Total Assessment is a certain percentage of the fair market value that is determined by local assessors to be the total taxable value of land and additions on the property. | Land | Improvement |
|---|---|---|---|---|
| 2025 | $10,760 | $1,377,700 | $931,400 | $446,300 |
| 2024 | $10,522 | $1,312,000 | $887,000 | $425,000 |
| 2023 | $10,229 | $1,161,100 | $785,000 | $376,100 |
| 2022 | $9,298 | $921,500 | $694,700 | $226,800 |
| 2021 | $9,033 | $838,700 | $632,200 | $206,500 |
| 2020 | $8,857 | $824,700 | $626,200 | $198,500 |
| 2019 | $8,550 | $813,500 | $626,200 | $187,300 |
| 2018 | $8,167 | $774,900 | $596,500 | $178,400 |
| 2017 | $7,964 | $773,200 | $596,500 | $176,700 |
| 2016 | $7,546 | $742,700 | $596,500 | $146,200 |
| 2015 | $7,078 | $702,900 | $556,700 | $146,200 |
Source: Public Records
Map
Nearby Homes
- 16 Washington Ave
- 22 Bay View Ave
- 34 Washington Ave
- 151 - 153 Main St
- 1 Pine Tree Dr
- 18 Carlton Rd
- 203 County Rd
- 46 Holt Rd
- 46 Holt Rd Unit A
- 3 Fairway Dr Unit F
- 56 Rip Van Winkle Way
- 18 Douglas Ave
- 13 Laurel Hill Ct
- 3 Wolf Rd
- 6 Unit 74
- 46 Winship Ave
- 12 Beachwood Rd
- 44 Cotuit Rd
- 5 Sea Knoll Ct
- 440 County Rd