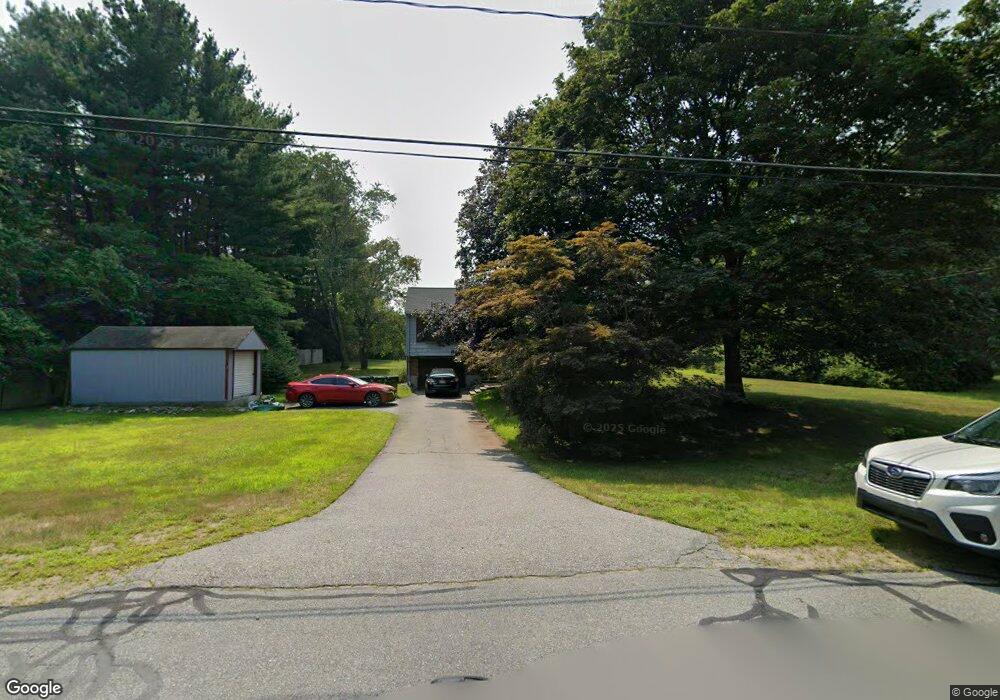
11 Bulkeley Rd Littleton, MA 01460
Estimated Value: $695,575 - $870,000
3
Beds
2
Baths
1,558
Sq Ft
$494/Sq Ft
Est. Value
About This Home
This home is located at 11 Bulkeley Rd, Littleton, MA 01460 and is currently estimated at $768,894, approximately $493 per square foot. 11 Bulkeley Rd is a home located in Middlesex County with nearby schools including Shaker Lane Elementary School, Russell Street Elementary School, and Littleton Middle School.
Ownership History
Date
Name
Owned For
Owner Type
Purchase Details
Closed on
Mar 28, 2012
Sold by
Buzby Jared and Dunphy Susan
Bought by
Walsh Vance J
Current Estimated Value
Home Financials for this Owner
Home Financials are based on the most recent Mortgage that was taken out on this home.
Original Mortgage
$307,014
Outstanding Balance
$210,235
Interest Rate
3.88%
Mortgage Type
New Conventional
Estimated Equity
$558,659
Purchase Details
Closed on
Aug 4, 1999
Sold by
Speliotis Elias D and Speliotis Mary K
Bought by
Dumphy Susan and Buzby Jared
Home Financials for this Owner
Home Financials are based on the most recent Mortgage that was taken out on this home.
Original Mortgage
$225,000
Interest Rate
7.54%
Mortgage Type
Purchase Money Mortgage
Create a Home Valuation Report for This Property
The Home Valuation Report is an in-depth analysis detailing your home's value as well as a comparison with similar homes in the area
Home Values in the Area
Average Home Value in this Area
Purchase History
| Date | Buyer | Sale Price | Title Company |
|---|---|---|---|
| Walsh Vance J | $315,000 | -- | |
| Dumphy Susan | $250,000 | -- |
Source: Public Records
Mortgage History
| Date | Status | Borrower | Loan Amount |
|---|---|---|---|
| Open | Walsh Vance J | $307,014 | |
| Previous Owner | Dumphy Susan | $225,000 | |
| Previous Owner | Dumphy Susan | $10,000 | |
| Previous Owner | Dumphy Susan | $120,000 |
Source: Public Records
Tax History Compared to Growth
Tax History
| Year | Tax Paid | Tax Assessment Tax Assessment Total Assessment is a certain percentage of the fair market value that is determined by local assessors to be the total taxable value of land and additions on the property. | Land | Improvement |
|---|---|---|---|---|
| 2025 | $8,932 | $601,100 | $257,000 | $344,100 |
| 2024 | $8,131 | $547,900 | $248,300 | $299,600 |
| 2023 | $8,294 | $510,400 | $228,700 | $281,700 |
| 2022 | $7,860 | $443,800 | $228,700 | $215,100 |
| 2021 | $7,383 | $417,100 | $220,000 | $197,100 |
| 2020 | $7,152 | $402,500 | $204,700 | $197,800 |
| 2019 | $6,935 | $380,200 | $178,600 | $201,600 |
| 2018 | $6,777 | $373,600 | $176,400 | $197,200 |
| 2017 | $6,603 | $363,800 | $176,400 | $187,400 |
| 2016 | $6,395 | $361,500 | $176,400 | $185,100 |
| 2015 | $6,297 | $347,900 | $152,500 | $195,400 |
Source: Public Records
Map
Nearby Homes
- Lot 2 Strawberry Farm
- 221 Foster St
- 63 Leonard Rd Unit 63
- 62 Waite Rd
- 150 Whitcomb Ave
- 18 Pleasant St
- 305 Harwood Ave
- 146 Tahattawan Rd
- 3 Taylor St
- 89 School House Ln
- 777 Depot Rd
- 139 Picnic St
- 17 Hartwell Ave
- 332 Old Littleton Rd
- 4 Omega Way
- 336 King St Unit 105
- 35 Queen Rd
- 34 Baldwin Hill Rd
- 8 Edsel Rd
- 17 Chestnut Ln
- 15 Bulkeley Rd
- 7 Bulkeley Rd
- 7 Bulkeley Rd Unit 7
- 3 Bulkeley Rd
- 6 Bulkeley Rd
- 17 Bulkeley Rd
- 10 Bulkeley Rd
- 5 Bulkeley Rd
- 286 Foster St
- 290 Foster St
- 2 Bulkeley Rd
- 284 Foster St
- 19 Bulkeley Rd
- 12 Bulkeley Rd
- 23 Bulkeley Rd
- 21 Bulkeley Rd
- 277 Foster St
- 279 Foster St Unit 279
- 14 Bulkeley Rd
- 25 Bulkeley Rd