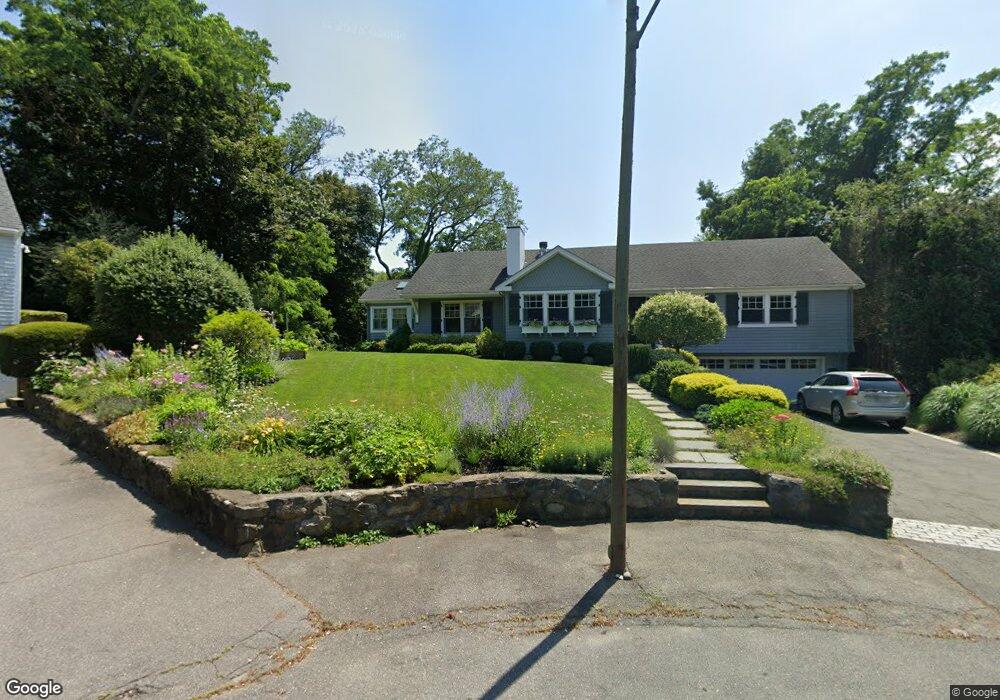
11 Calumet Ln Marblehead, MA 01945
Estimated Value: $1,369,368 - $1,598,000
3
Beds
2
Baths
2,189
Sq Ft
$661/Sq Ft
Est. Value
About This Home
This home is located at 11 Calumet Ln, Marblehead, MA 01945 and is currently estimated at $1,447,592, approximately $661 per square foot. 11 Calumet Ln is a home located in Essex County with nearby schools including Marblehead High School, Marblehead Community Charter Public School, and Tower School.
Ownership History
Date
Name
Owned For
Owner Type
Purchase Details
Closed on
Oct 20, 2011
Sold by
Burchfield Diana H
Bought by
Mccreedy Matthew B and Mccreedy Kathryn A
Current Estimated Value
Purchase Details
Closed on
Feb 21, 2008
Sold by
Hosley Richard F
Bought by
Hosley Richard F
Create a Home Valuation Report for This Property
The Home Valuation Report is an in-depth analysis detailing your home's value as well as a comparison with similar homes in the area
Home Values in the Area
Average Home Value in this Area
Purchase History
| Date | Buyer | Sale Price | Title Company |
|---|---|---|---|
| Mccreedy Matthew B | $550,000 | -- | |
| Mccreedy Matthew B | $550,000 | -- | |
| Hosley Richard F | -- | -- | |
| Hosley Richard F | -- | -- |
Source: Public Records
Mortgage History
| Date | Status | Borrower | Loan Amount |
|---|---|---|---|
| Open | Hosley Richard F | $300,000 |
Source: Public Records
Tax History
| Year | Tax Paid | Tax Assessment Tax Assessment Total Assessment is a certain percentage of the fair market value that is determined by local assessors to be the total taxable value of land and additions on the property. | Land | Improvement |
|---|---|---|---|---|
| 2025 | $11,210 | $1,238,700 | $811,200 | $427,500 |
| 2024 | $12,214 | $1,363,200 | $1,133,300 | $229,900 |
| 2023 | $8,987 | $898,700 | $644,200 | $254,500 |
| 2022 | $9,346 | $888,400 | $636,300 | $252,100 |
| 2021 | $8,593 | $824,700 | $572,600 | $252,100 |
| 2020 | $8,215 | $790,700 | $572,600 | $218,100 |
| 2019 | $8,125 | $756,500 | $540,800 | $215,700 |
| 2018 | $7,986 | $724,700 | $509,000 | $215,700 |
| 2017 | $7,454 | $677,000 | $461,300 | $215,700 |
| 2016 | $7,338 | $661,100 | $445,400 | $215,700 |
| 2015 | $6,260 | $565,000 | $413,600 | $151,400 |
| 2014 | $5,871 | $529,400 | $381,800 | $147,600 |
Source: Public Records
Map
Nearby Homes
- 30 Haley Rd Unit 1
- 72 Village St
- 197A W Shore Dr Unit A
- 33 W Shore Dr
- 282 Pleasant St
- 34 Lafayette St
- 6 Mount Vernon St
- 54 Rowland St
- 145 Evans Road Extension
- 1 Knollwood Rd
- 8 Linden St
- 290 Washington St Unit A
- 7 Cottage St
- 55 Roosevelt Ave
- 23 Wyman Rd
- 41 Atlantic Ave Unit 3
- 41 Atlantic Ave Unit 1
- 4 Dean Rd
- 126 Lafayette St
- 63 Green St
Your Personal Tour Guide
Ask me questions while you tour the home.