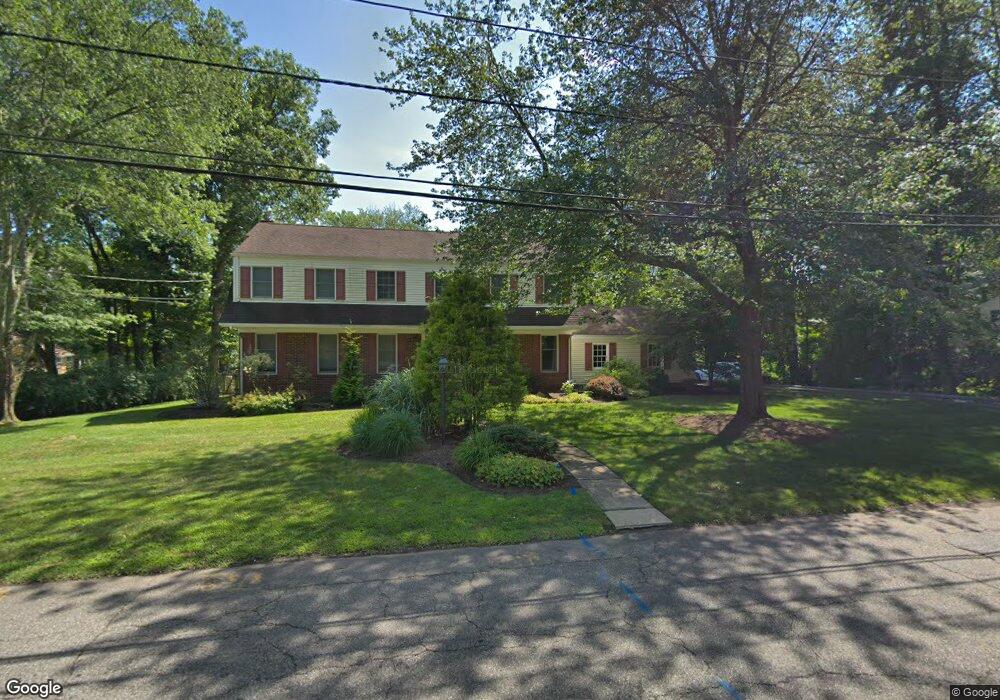
11 Cambridge Rd Woodcliff Lake, NJ 07677
Estimated Value: $1,178,000 - $1,271,000
--
Bed
--
Bath
2,820
Sq Ft
$434/Sq Ft
Est. Value
About This Home
This home is located at 11 Cambridge Rd, Woodcliff Lake, NJ 07677 and is currently estimated at $1,224,445, approximately $434 per square foot. 11 Cambridge Rd is a home located in Bergen County with nearby schools including Dorchester Elementary School, Woodcliff Middle School, and Pascack Hills High School.
Ownership History
Date
Name
Owned For
Owner Type
Purchase Details
Closed on
Aug 16, 2016
Sold by
Siegler Mark and Siegler Edith
Bought by
Siegel Douglas T and Siegel Jolie
Current Estimated Value
Home Financials for this Owner
Home Financials are based on the most recent Mortgage that was taken out on this home.
Original Mortgage
$63,250
Outstanding Balance
$50,603
Interest Rate
3.48%
Mortgage Type
Credit Line Revolving
Estimated Equity
$1,173,842
Create a Home Valuation Report for This Property
The Home Valuation Report is an in-depth analysis detailing your home's value as well as a comparison with similar homes in the area
Home Values in the Area
Average Home Value in this Area
Purchase History
| Date | Buyer | Sale Price | Title Company |
|---|---|---|---|
| Siegel Douglas T | $820,000 | Acres Land Title Agency Inc |
Source: Public Records
Mortgage History
| Date | Status | Borrower | Loan Amount |
|---|---|---|---|
| Open | Siegel Douglas T | $63,250 | |
| Open | Siegel Douglas T | $591,750 |
Source: Public Records
Tax History Compared to Growth
Tax History
| Year | Tax Paid | Tax Assessment Tax Assessment Total Assessment is a certain percentage of the fair market value that is determined by local assessors to be the total taxable value of land and additions on the property. | Land | Improvement |
|---|---|---|---|---|
| 2025 | $19,039 | $926,700 | $442,200 | $484,500 |
| 2024 | $18,149 | $880,600 | $409,700 | $470,900 |
| 2023 | $16,605 | $838,300 | $384,700 | $453,600 |
| 2022 | $16,605 | $758,900 | $358,300 | $400,600 |
| 2021 | $15,786 | $720,800 | $325,800 | $395,000 |
| 2020 | $15,058 | $716,700 | $324,300 | $392,400 |
| 2019 | $14,905 | $713,500 | $321,800 | $391,700 |
| 2018 | $14,600 | $704,300 | $317,800 | $386,500 |
| 2017 | $14,567 | $696,300 | $313,300 | $383,000 |
| 2016 | $14,603 | $681,100 | $308,300 | $372,800 |
| 2015 | $14,625 | $688,900 | $318,300 | $370,600 |
| 2014 | $14,617 | $661,700 | $305,400 | $356,300 |
Source: Public Records
Map
Nearby Homes
- 66 Rose Ave
- 72 Rose Ave
- 26 Daniel Ct
- 100 Overlook Dr
- 276 Werimus Rd
- 20 Stephan Ct
- 36 Wildwood Rd
- 42 Werimus Rd
- 61 Overlook Dr
- 75 Woodcliff Lake Rd
- 256 Pascack Rd
- 60 Fremont Ave
- 23 Denison Dr E
- 7 Stony Ridge Dr
- 21 Hunter Ridge
- 50 S 5th St
- 16 Old Farms Rd
- 15 Oak Trail Rd
- 160 Spring Valley Rd
- 188 Broadway Unit 1