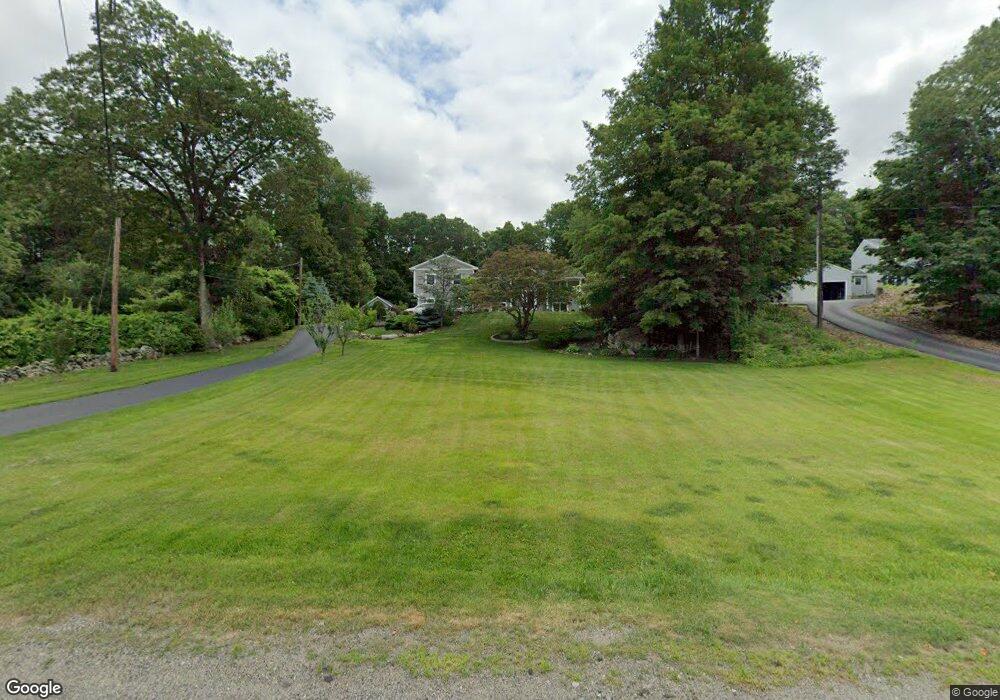
11 Carlstrom Ln Millbury, MA 01527
Estimated Value: $453,000 - $542,391
4
Beds
2
Baths
1,008
Sq Ft
$493/Sq Ft
Est. Value
About This Home
This home is located at 11 Carlstrom Ln, Millbury, MA 01527 and is currently estimated at $496,848, approximately $492 per square foot. 11 Carlstrom Ln is a home located in Worcester County with nearby schools including Elmwood Street Elementary School, Raymond E. Shaw Elementary School, and Millbury Junior/Senior High School.
Ownership History
Date
Name
Owned For
Owner Type
Purchase Details
Closed on
May 30, 2006
Sold by
Mcardle Cynthia and Nielsen-Mcardle Cynthia
Bought by
Dziminski Vicky and Dziminski Zbigniew
Current Estimated Value
Home Financials for this Owner
Home Financials are based on the most recent Mortgage that was taken out on this home.
Original Mortgage
$208,000
Outstanding Balance
$122,013
Interest Rate
6.53%
Mortgage Type
Purchase Money Mortgage
Estimated Equity
$374,835
Purchase Details
Closed on
Jan 5, 1993
Sold by
Schulien Susan J and Mcardle John S
Bought by
Mcardle John S and Mcardle Cynthia
Home Financials for this Owner
Home Financials are based on the most recent Mortgage that was taken out on this home.
Original Mortgage
$55,000
Interest Rate
8.32%
Mortgage Type
Purchase Money Mortgage
Create a Home Valuation Report for This Property
The Home Valuation Report is an in-depth analysis detailing your home's value as well as a comparison with similar homes in the area
Home Values in the Area
Average Home Value in this Area
Purchase History
| Date | Buyer | Sale Price | Title Company |
|---|---|---|---|
| Dziminski Vicky | $260,000 | -- | |
| Dziminski Vicky | $260,000 | -- | |
| Mcardle John S | $118,750 | -- | |
| Mcardle John S | $118,750 | -- |
Source: Public Records
Mortgage History
| Date | Status | Borrower | Loan Amount |
|---|---|---|---|
| Open | Dziminski Vicky | $208,000 | |
| Closed | Mcardle John S | $208,000 | |
| Previous Owner | Mcardle John S | $55,000 |
Source: Public Records
Tax History Compared to Growth
Tax History
| Year | Tax Paid | Tax Assessment Tax Assessment Total Assessment is a certain percentage of the fair market value that is determined by local assessors to be the total taxable value of land and additions on the property. | Land | Improvement |
|---|---|---|---|---|
| 2025 | $6,074 | $453,600 | $125,400 | $328,200 |
| 2024 | $5,574 | $421,300 | $116,000 | $305,300 |
| 2023 | $5,052 | $349,600 | $81,200 | $268,400 |
| 2022 | $4,713 | $314,200 | $81,200 | $233,000 |
| 2021 | $3,927 | $300,800 | $81,200 | $219,600 |
| 2020 | $4,758 | $310,400 | $81,200 | $229,200 |
| 2019 | $4,828 | $304,600 | $80,900 | $223,700 |
| 2018 | $4,603 | $281,700 | $80,900 | $200,800 |
| 2017 | $3,376 | $241,700 | $84,400 | $157,300 |
| 2016 | $3,745 | $227,500 | $84,400 | $143,100 |
| 2015 | $3,750 | $227,800 | $89,900 | $137,900 |
| 2014 | $3,665 | $214,300 | $89,900 | $124,400 |
Source: Public Records
Map
Nearby Homes
- 0 Auburn Rd
- 32 Horne Way
- 58 Beach St
- 101 Horne Way
- 152 W Main St Unit A
- 214 W Main St
- 11 Laurel Dr
- 318 W Main St
- 33 Tainter Hill Rd Unit 33B
- 5- 33 Tainter Hill Rd Unit 33A
- 5- 33 Tainter Hill Rd
- 38 Singletary Rd
- 394 1/2 Greenwood St
- 359 W Main St
- 130 Singletary Ave
- 29 Winwood Rd
- 2 Camden Dr
- 4 Jessica j Dr
- 6 Whitetail Run
- 168 Burbank Rd
- 13 Carlstrom Ln
- 7 Carlstrom Ln
- 10 Carlstrom Ln
- 17 Carlstrom Ln
- 15 Carlstrom Ln Unit 17
- 5 Carlstrom Ln
- 8 Carlstrom Ln
- 12 Carlstrom Ln
- 6 Carlstrom Ln
- 14 Carlstrom Ln
- 5 Carleton Rd
- 7 Carleton Rd
- 3 Carleton Rd
- 47 (LOT 1) Carleton Rd
- 1 Carleton Rd
- 9 Carleton Rd
- 1 Carlstrom Ln
- 11 Carleton Rd
- 2 Carleton Rd
- 4 Carleton Rd