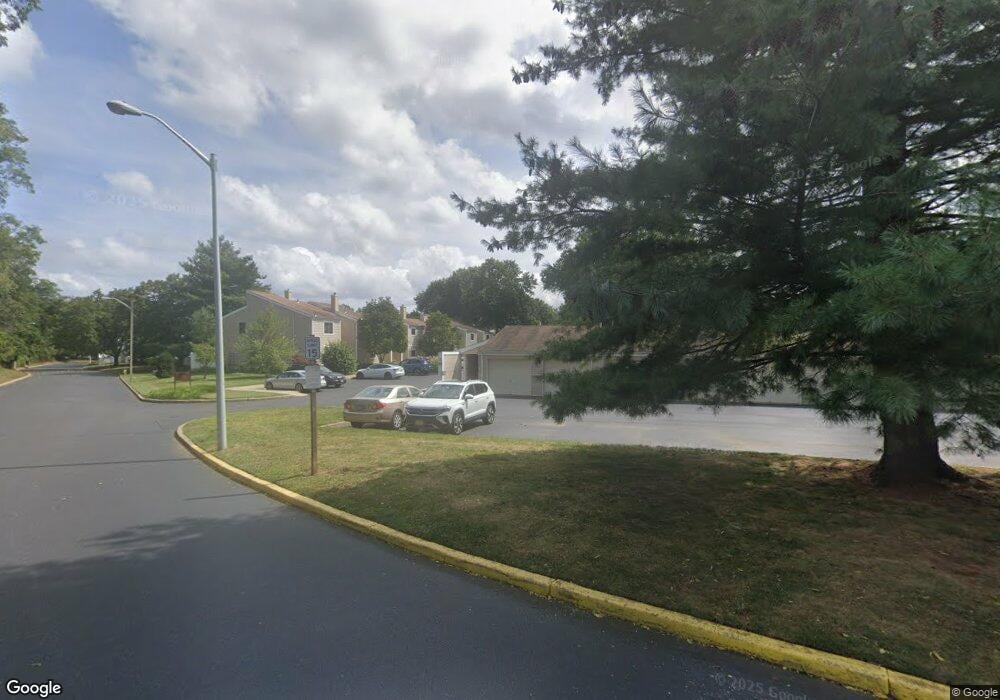
11 Carol Ct Tinton Falls, NJ 07724
Estimated Value: $359,000 - $415,000
1
Bed
1
Bath
959
Sq Ft
$402/Sq Ft
Est. Value
About This Home
This home is located at 11 Carol Ct, Tinton Falls, NJ 07724 and is currently estimated at $385,494, approximately $401 per square foot. 11 Carol Ct is a home located in Monmouth County with nearby schools including Mahala F. Atchinson Elementary School, Swimming River Elementary School, and Tinton Falls Middle School.
Ownership History
Date
Name
Owned For
Owner Type
Purchase Details
Closed on
Mar 4, 2022
Sold by
Vincent Kazmierski
Bought by
Kazmierski Ivana
Current Estimated Value
Purchase Details
Closed on
Jan 2, 2010
Sold by
Merlino Joseph
Bought by
Kazmierski Vincent and Berzanski Michael
Home Financials for this Owner
Home Financials are based on the most recent Mortgage that was taken out on this home.
Original Mortgage
$181,649
Interest Rate
5.5%
Mortgage Type
FHA
Purchase Details
Closed on
Aug 25, 2006
Sold by
Tortoriello Anita
Bought by
Merlino Joseph
Home Financials for this Owner
Home Financials are based on the most recent Mortgage that was taken out on this home.
Original Mortgage
$174,800
Interest Rate
5.87%
Mortgage Type
Adjustable Rate Mortgage/ARM
Purchase Details
Closed on
May 5, 2006
Sold by
Izzo Lynda G Tortoriello
Bought by
Izzo Lynda G Tortoriello
Create a Home Valuation Report for This Property
The Home Valuation Report is an in-depth analysis detailing your home's value as well as a comparison with similar homes in the area
Home Values in the Area
Average Home Value in this Area
Purchase History
| Date | Buyer | Sale Price | Title Company |
|---|---|---|---|
| Kazmierski Ivana | -- | Schwartz & Schwartz | |
| Kazmierski Vincent | $185,000 | None Available | |
| Merlino Joseph | $218,500 | -- | |
| Izzo Lynda G Tortoriello | -- | -- |
Source: Public Records
Mortgage History
| Date | Status | Borrower | Loan Amount |
|---|---|---|---|
| Previous Owner | Kazmierski Vincent | $181,649 | |
| Previous Owner | Merlino Joseph | $174,800 |
Source: Public Records
Tax History Compared to Growth
Tax History
| Year | Tax Paid | Tax Assessment Tax Assessment Total Assessment is a certain percentage of the fair market value that is determined by local assessors to be the total taxable value of land and additions on the property. | Land | Improvement |
|---|---|---|---|---|
| 2025 | $4,603 | $325,700 | $166,500 | $159,200 |
| 2024 | $4,423 | $316,600 | $161,000 | $155,600 |
| 2023 | $4,423 | $287,600 | $135,000 | $152,600 |
| 2022 | $4,058 | $246,800 | $110,000 | $136,800 |
| 2021 | $4,058 | $209,500 | $100,000 | $109,500 |
| 2020 | $3,749 | $187,000 | $80,000 | $107,000 |
| 2019 | $3,728 | $186,400 | $80,000 | $106,400 |
| 2018 | $3,737 | $186,500 | $85,000 | $101,500 |
| 2017 | $3,562 | $173,400 | $75,000 | $98,400 |
| 2016 | $3,753 | $178,900 | $75,000 | $103,900 |
| 2015 | $3,758 | $181,200 | $80,000 | $101,200 |
| 2014 | $3,381 | $155,500 | $55,000 | $100,500 |
Source: Public Records
Map
Nearby Homes