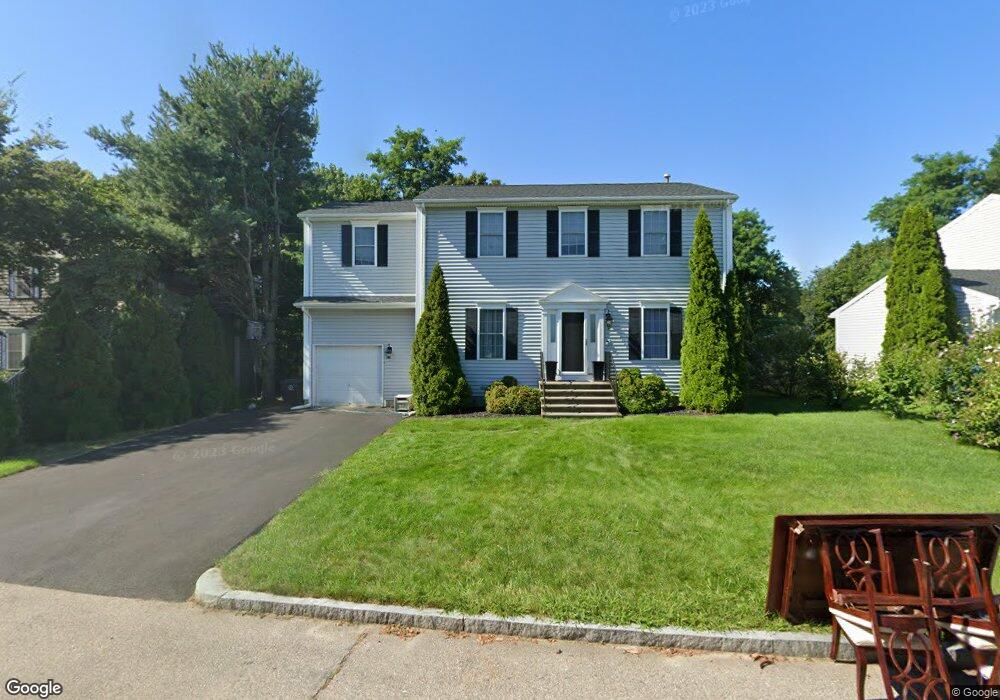
11 Carousel Dr Riverside, RI 02915
Riverside NeighborhoodEstimated Value: $696,000 - $758,000
4
Beds
3
Baths
1,664
Sq Ft
$438/Sq Ft
Est. Value
About This Home
This home is located at 11 Carousel Dr, Riverside, RI 02915 and is currently estimated at $729,357, approximately $438 per square foot. 11 Carousel Dr is a home located in Providence County with nearby schools including East Providence High School, St Luke Elementary School, and St Mary Academy-Bay View.
Ownership History
Date
Name
Owned For
Owner Type
Purchase Details
Closed on
Mar 20, 2006
Sold by
Sirva Relocation
Bought by
Mccarthy Shawn A and Mccarthy Erin L
Current Estimated Value
Home Financials for this Owner
Home Financials are based on the most recent Mortgage that was taken out on this home.
Original Mortgage
$304,400
Interest Rate
6.27%
Mortgage Type
Purchase Money Mortgage
Purchase Details
Closed on
May 3, 2001
Sold by
Jgp Builders Inc
Bought by
Palmer Paul
Create a Home Valuation Report for This Property
The Home Valuation Report is an in-depth analysis detailing your home's value as well as a comparison with similar homes in the area
Home Values in the Area
Average Home Value in this Area
Purchase History
| Date | Buyer | Sale Price | Title Company |
|---|---|---|---|
| Mccarthy Shawn A | $580,500 | -- | |
| Sirva Relocation Llc | $405,000 | -- | |
| Palmer Paul | $224,000 | -- | |
| Sirva Relocation Llc | $405,000 | -- | |
| Palmer Paul | $224,000 | -- |
Source: Public Records
Mortgage History
| Date | Status | Borrower | Loan Amount |
|---|---|---|---|
| Open | Palmer Paul | $335,680 | |
| Closed | Palmer Paul | $343,000 | |
| Closed | Palmer Paul | $304,400 |
Source: Public Records
Tax History
| Year | Tax Paid | Tax Assessment Tax Assessment Total Assessment is a certain percentage of the fair market value that is determined by local assessors to be the total taxable value of land and additions on the property. | Land | Improvement |
|---|---|---|---|---|
| 2025 | $8,501 | $650,400 | $199,400 | $451,000 |
| 2024 | $7,711 | $503,000 | $166,200 | $336,800 |
| 2023 | $7,424 | $503,000 | $166,200 | $336,800 |
| 2022 | $7,937 | $363,100 | $105,300 | $257,800 |
| 2021 | $7,768 | $361,300 | $103,500 | $257,800 |
| 2020 | $7,439 | $361,300 | $103,500 | $257,800 |
| 2019 | $7,233 | $361,300 | $103,500 | $257,800 |
| 2018 | $7,081 | $309,500 | $89,600 | $219,900 |
| 2017 | $6,924 | $309,500 | $89,600 | $219,900 |
| 2016 | $6,889 | $309,500 | $89,600 | $219,900 |
| 2015 | $7,769 | $338,500 | $89,000 | $249,500 |
| 2014 | $7,769 | $338,500 | $89,000 | $249,500 |
Source: Public Records
Map
Nearby Homes
Your Personal Tour Guide
Ask me questions while you tour the home.