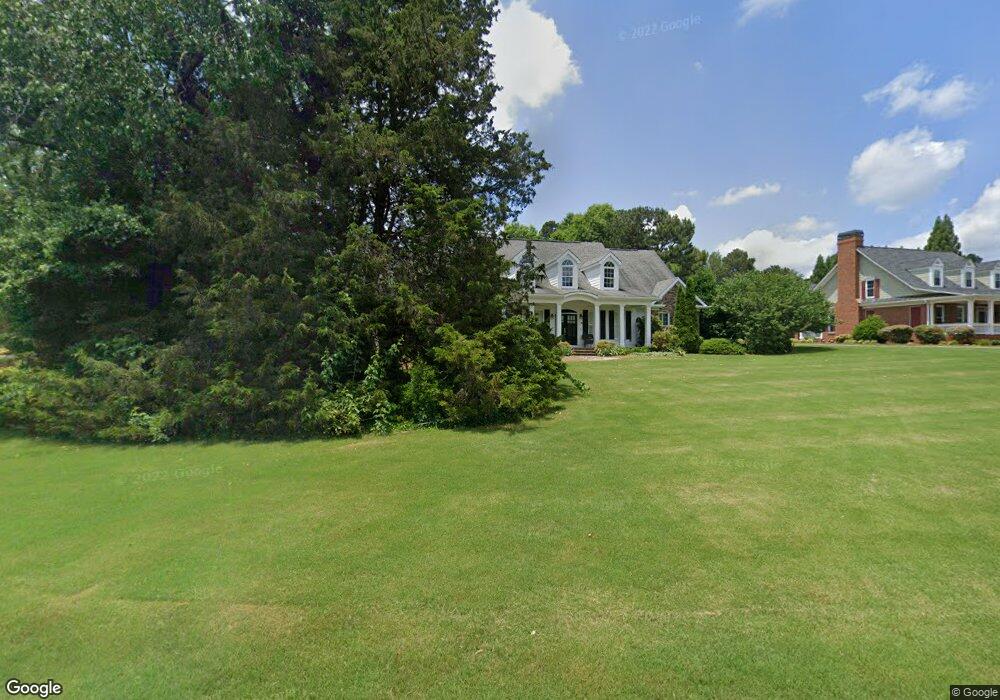
11 Cass Sta Pass NW Cartersville, GA 30121
Estimated Value: $543,000 - $756,000
4
Beds
4
Baths
2,718
Sq Ft
$224/Sq Ft
Est. Value
About This Home
This home is located at 11 Cass Sta Pass NW, Cartersville, GA 30121 and is currently estimated at $610,002, approximately $224 per square foot. 11 Cass Sta Pass NW is a home located in Bartow County with nearby schools including Hamilton Crossing Elementary School, Cass Middle School, and Cass High School.
Ownership History
Date
Name
Owned For
Owner Type
Purchase Details
Closed on
Aug 1, 2019
Sold by
Gross Peter
Bought by
Ferguson Steve
Current Estimated Value
Home Financials for this Owner
Home Financials are based on the most recent Mortgage that was taken out on this home.
Original Mortgage
$422,750
Outstanding Balance
$370,251
Interest Rate
3.7%
Mortgage Type
New Conventional
Estimated Equity
$239,751
Purchase Details
Closed on
Nov 19, 2014
Sold by
Mitchell William L
Bought by
Gross Kathleen H and Gross Peter R
Home Financials for this Owner
Home Financials are based on the most recent Mortgage that was taken out on this home.
Original Mortgage
$318,250
Interest Rate
3.95%
Mortgage Type
New Conventional
Create a Home Valuation Report for This Property
The Home Valuation Report is an in-depth analysis detailing your home's value as well as a comparison with similar homes in the area
Home Values in the Area
Average Home Value in this Area
Purchase History
| Date | Buyer | Sale Price | Title Company |
|---|---|---|---|
| Ferguson Steve | $457,500 | -- | |
| Gross Kathleen H | $360,000 | -- |
Source: Public Records
Mortgage History
| Date | Status | Borrower | Loan Amount |
|---|---|---|---|
| Open | Ferguson Steve | $422,750 | |
| Previous Owner | Gross Kathleen H | $318,250 |
Source: Public Records
Tax History Compared to Growth
Tax History
| Year | Tax Paid | Tax Assessment Tax Assessment Total Assessment is a certain percentage of the fair market value that is determined by local assessors to be the total taxable value of land and additions on the property. | Land | Improvement |
|---|---|---|---|---|
| 2024 | $2,374 | $217,139 | $40,000 | $177,139 |
| 2023 | $2,433 | $210,324 | $28,000 | $182,324 |
| 2022 | $2,141 | $186,090 | $28,000 | $158,090 |
| 2021 | $1,182 | $145,206 | $28,000 | $117,206 |
| 2020 | $1,507 | $145,206 | $28,000 | $117,206 |
| 2019 | $2,921 | $133,870 | $28,000 | $105,870 |
| 2018 | $3,340 | $124,880 | $16,000 | $108,880 |
| 2017 | $3,497 | $124,880 | $16,000 | $108,880 |
| 2016 | $3,523 | $124,880 | $16,000 | $108,880 |
| 2015 | $3,529 | $124,880 | $16,000 | $108,880 |
| 2014 | $2,421 | $111,600 | $16,000 | $95,600 |
| 2013 | -- | $101,320 | $16,000 | $85,320 |
Source: Public Records
Map
Nearby Homes
- 36 Johnston Row NW
- 402 Mac Johnson Rd NW
- 64 Shinall Gaines Rd NW
- 14 Arbors Way NW
- 399 Rudy York Rd NW
- 76 Walker Rd NW
- 107 Jewell Rd NW
- 34 Fire Tower Rd NW
- 1820 Cassville Rd NW
- 12 Walker Rd NW
- 42 Meadowview Rd NW
- 29 Camelot Dr
- 1422 Cassville Rd NW
- 2396 Joe Frank Harris Pkwy NW
- 251 Mac Johnson Rd NW
- 130 Jane Blvd NW
- 337 Mac Johnson Rd NW
- 100 Valley View Dr NW
- 13 Mercer Dr NW
- 0 Mercer Dr Unit 8181689
- 0 Cass Station Pass NW Unit 73 7025116
- 0 Cass Station Pass NW Unit 7060974
- 0 Cass Station Pass NW Unit 5089230
- 0 Cass Station Pass NW Unit 5117872
- 12 Cass Sta Pass NW
- 12 Cass Station Pass NW
- 12 Cass Station Dr NW
- 15 Mercer Dr NW
- 11 Starlight Dr NW
- 36 Latimer Ln NW
- 34 Latimer Ln NW
- 12 Mercer Dr NW
- 38 Latimer Ln NW
- 14 Mercer Dr NW
- 14 Mercer Ln
- 14 Cass Sta Pass NW
- 17 Mercer Dr NW
- 13 Starlight Dr NW