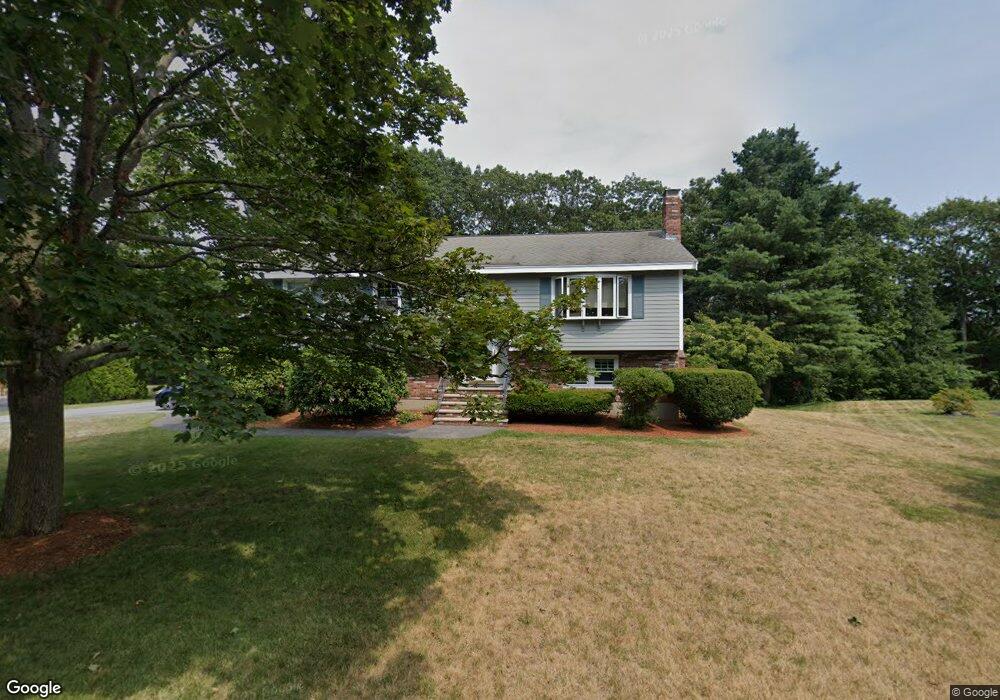
11 Cedar Hill Dr Danvers, MA 01923
Estimated Value: $820,000 - $990,000
3
Beds
3
Baths
2,078
Sq Ft
$428/Sq Ft
Est. Value
About This Home
This home is located at 11 Cedar Hill Dr, Danvers, MA 01923 and is currently estimated at $889,422, approximately $428 per square foot. 11 Cedar Hill Dr is a home located in Essex County with nearby schools including Danvers High School, St. Mary of the Annunciation School, and St. John's Prep.
Ownership History
Date
Name
Owned For
Owner Type
Purchase Details
Closed on
Sep 4, 2025
Sold by
Standley Joseph L and Standley Nancy L
Bought by
Standley Ft Of 2018 and Standley
Current Estimated Value
Purchase Details
Closed on
Sep 21, 1995
Sold by
Randall Charles and Randall Janis
Bought by
Stanley Ii Joseph and Stanley Nancy
Create a Home Valuation Report for This Property
The Home Valuation Report is an in-depth analysis detailing your home's value as well as a comparison with similar homes in the area
Home Values in the Area
Average Home Value in this Area
Purchase History
| Date | Buyer | Sale Price | Title Company |
|---|---|---|---|
| Standley Ft Of 2018 | -- | -- | |
| Standley Ft Of 2018 | -- | -- | |
| Stanley Ii Joseph | $205,000 | -- | |
| Stanley Joseph | $205,000 | -- |
Source: Public Records
Mortgage History
| Date | Status | Borrower | Loan Amount |
|---|---|---|---|
| Previous Owner | Stanley Joseph | $50,000 | |
| Previous Owner | Stanley Joseph | $145,500 |
Source: Public Records
Tax History
| Year | Tax Paid | Tax Assessment Tax Assessment Total Assessment is a certain percentage of the fair market value that is determined by local assessors to be the total taxable value of land and additions on the property. | Land | Improvement |
|---|---|---|---|---|
| 2025 | $8,586 | $781,300 | $433,100 | $348,200 |
| 2024 | $7,991 | $719,300 | $425,900 | $293,400 |
| 2023 | $7,681 | $653,700 | $389,800 | $263,900 |
| 2022 | $7,457 | $589,000 | $346,500 | $242,500 |
| 2021 | $7,806 | $584,700 | $342,200 | $242,500 |
| 2020 | $7,683 | $588,300 | $342,200 | $246,100 |
| 2019 | $7,390 | $556,500 | $310,400 | $246,100 |
| 2018 | $7,144 | $527,600 | $310,400 | $217,200 |
| 2017 | $6,661 | $469,400 | $267,100 | $202,300 |
| 2016 | $6,461 | $455,000 | $252,700 | $202,300 |
| 2015 | $6,225 | $417,500 | $231,000 | $186,500 |
Source: Public Records
Map
Nearby Homes
- 12 Tulane Rd
- 78 North St
- 26 Ledgewood Dr
- 55 Burley St
- 2 Chapel Rd
- 5 Main Dr
- 16 Burnham Rd
- 3 Conrad Cir
- 207 Topsfield Rd
- 35 Locust St Unit 3
- 7 Paulette Dr
- 20 Central Ave
- 10 Cottage Ave
- 22 Maple Ave
- 14 Chase St
- 19 Bridle Spur Ln
- 43 Hobart St Unit B
- 466 Newbury St Unit 20
- 14 Williams St Unit C17
- 5 Holten St
Your Personal Tour Guide
Ask me questions while you tour the home.