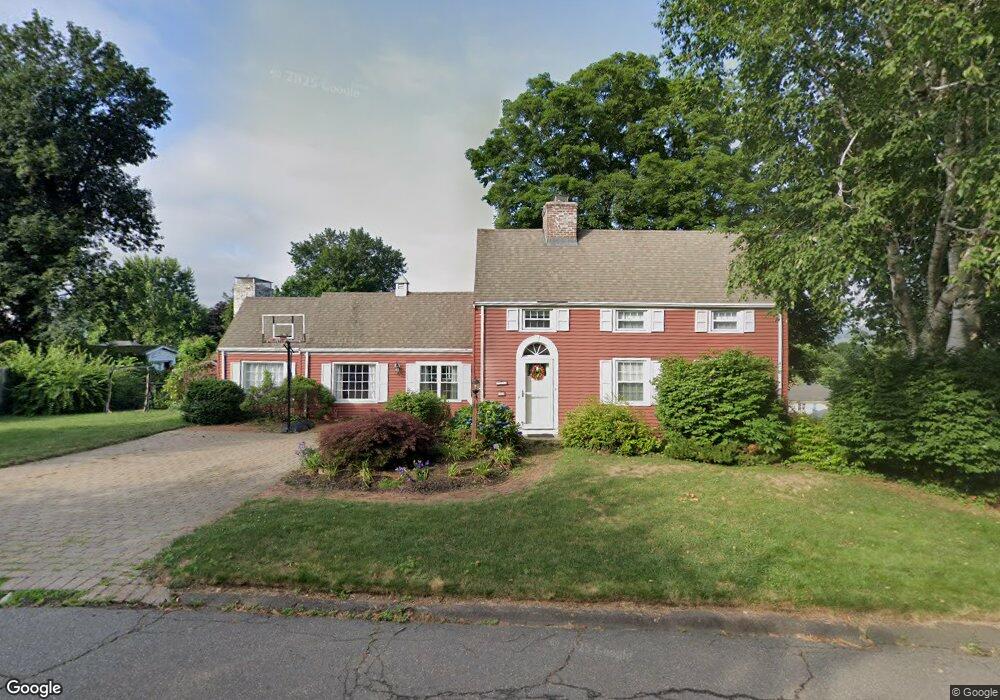
11 Cedar St Wallingford, CT 06492
Estimated Value: $494,772 - $578,000
3
Beds
2
Baths
2,057
Sq Ft
$258/Sq Ft
Est. Value
About This Home
This home is located at 11 Cedar St, Wallingford, CT 06492 and is currently estimated at $530,693, approximately $257 per square foot. 11 Cedar St is a home located in New Haven County with nearby schools including Evarts C. Stevens School, Pond Hill Elementary School, and Dag Hammarskjold Middle School.
Ownership History
Date
Name
Owned For
Owner Type
Purchase Details
Closed on
Jan 10, 2020
Sold by
Martino Thomas and Martino Kim
Bought by
Germond Kate and Germond William
Current Estimated Value
Home Financials for this Owner
Home Financials are based on the most recent Mortgage that was taken out on this home.
Original Mortgage
$256,000
Outstanding Balance
$226,186
Interest Rate
3.6%
Mortgage Type
Purchase Money Mortgage
Estimated Equity
$304,507
Purchase Details
Closed on
Oct 27, 1994
Sold by
Sunwood Dev Corp
Bought by
Dansereao Thomas E and Dansereao Carrie L
Create a Home Valuation Report for This Property
The Home Valuation Report is an in-depth analysis detailing your home's value as well as a comparison with similar homes in the area
Home Values in the Area
Average Home Value in this Area
Purchase History
| Date | Buyer | Sale Price | Title Company |
|---|---|---|---|
| Germond Kate | $320,000 | None Available | |
| Germond Kate | $320,000 | None Available | |
| Dansereao Thomas E | $180,900 | -- |
Source: Public Records
Mortgage History
| Date | Status | Borrower | Loan Amount |
|---|---|---|---|
| Open | Germond Kate | $256,000 | |
| Closed | Germond Kate | $256,000 | |
| Previous Owner | Dansereao Thomas E | $25,000 | |
| Previous Owner | Dansereao Thomas E | $100,000 | |
| Previous Owner | Dansereao Thomas E | $50,000 |
Source: Public Records
Tax History
| Year | Tax Paid | Tax Assessment Tax Assessment Total Assessment is a certain percentage of the fair market value that is determined by local assessors to be the total taxable value of land and additions on the property. | Land | Improvement |
|---|---|---|---|---|
| 2025 | $7,427 | $307,900 | $93,400 | $214,500 |
| 2024 | $6,466 | $210,900 | $82,500 | $128,400 |
| 2023 | $6,188 | $210,900 | $82,500 | $128,400 |
| 2022 | $6,125 | $210,900 | $82,500 | $128,400 |
| 2021 | $5,730 | $200,900 | $82,500 | $118,400 |
| 2020 | $5,546 | $190,000 | $87,800 | $102,200 |
| 2019 | $5,546 | $190,000 | $87,800 | $102,200 |
| 2018 | $5,442 | $190,000 | $87,800 | $102,200 |
| 2017 | $5,425 | $190,000 | $87,800 | $102,200 |
| 2016 | $5,299 | $190,000 | $87,800 | $102,200 |
| 2015 | $5,219 | $190,000 | $87,800 | $102,200 |
| 2014 | $5,109 | $190,000 | $87,800 | $102,200 |
Source: Public Records
Map
Nearby Homes
- 319 S Main St
- 303 S Elm St Unit 303
- 120 S Cherry St
- 69 Terrace Gardens
- 57 Terrace Gardens Unit 57
- 27 Londonderry Dr
- 137 Judd Square Unit 137
- 42 S Cherry St Unit 238
- 85 N Colony St
- 31 S Turnpike Rd Unit C2
- 30 Clinton Place
- 229 Woodhouse Ave
- 90 Masonic Ave
- 70 Putter Dr Unit 211
- 21 Putter Dr Unit 303S
- 16 Putter Dr Unit 207S
- 129 Brentwood Dr
- 46 Walnut Ln
- 134 E Main St
- 3 Spice Hill Dr
Your Personal Tour Guide
Ask me questions while you tour the home.