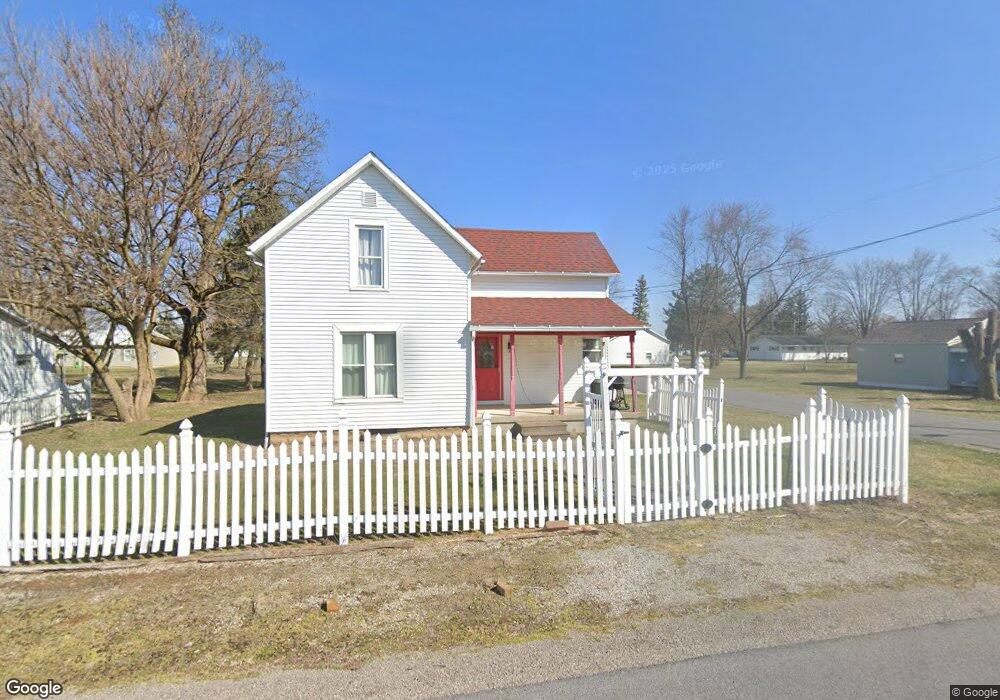
11 Center St Leipsic, OH 45856
Estimated Value: $109,000 - $161,000
3
Beds
1
Bath
1,320
Sq Ft
$98/Sq Ft
Est. Value
About This Home
This home is located at 11 Center St, Leipsic, OH 45856 and is currently estimated at $130,005, approximately $98 per square foot. 11 Center St is a home located in Putnam County with nearby schools including Leipsic Elementary School, Leipsic High School, and St. Mary's Catholic School.
Ownership History
Date
Name
Owned For
Owner Type
Purchase Details
Closed on
Mar 31, 2010
Sold by
Secretary Of Housing & Urban Development
Bought by
Dunlap Matthew D
Current Estimated Value
Home Financials for this Owner
Home Financials are based on the most recent Mortgage that was taken out on this home.
Original Mortgage
$54,851
Outstanding Balance
$35,742
Interest Rate
4.96%
Mortgage Type
Credit Line Revolving
Estimated Equity
$94,263
Purchase Details
Closed on
Sep 28, 2009
Sold by
Kuhlman Ken G
Bought by
National City Mortgage Co
Purchase Details
Closed on
Sep 25, 2009
Sold by
National City Real Estate Services Llc
Bought by
Secretary Of Housing & Urban Development
Purchase Details
Closed on
Jun 10, 2004
Bought by
Dunlap Matthew D
Purchase Details
Closed on
May 10, 2001
Bought by
Secretary Of Housing & Urban
Create a Home Valuation Report for This Property
The Home Valuation Report is an in-depth analysis detailing your home's value as well as a comparison with similar homes in the area
Purchase History
| Date | Buyer | Sale Price | Title Company |
|---|---|---|---|
| Dunlap Matthew D | $30,127 | None Available | |
| National City Mortgage Co | $56,000 | None Available | |
| Secretary Of Housing & Urban Development | -- | None Available | |
| Dunlap Matthew D | -- | -- | |
| Secretary Of Housing & Urban | -- | -- |
Source: Public Records
Mortgage History
| Date | Status | Borrower | Loan Amount |
|---|---|---|---|
| Open | Dunlap Matthew D | $54,851 |
Source: Public Records
Tax History
| Year | Tax Paid | Tax Assessment Tax Assessment Total Assessment is a certain percentage of the fair market value that is determined by local assessors to be the total taxable value of land and additions on the property. | Land | Improvement |
|---|---|---|---|---|
| 2025 | $1,155 | $29,240 | $1,090 | $28,150 |
| 2024 | $1,155 | $29,240 | $1,090 | $28,150 |
| 2023 | $1,186 | $21,980 | $880 | $21,100 |
| 2022 | $1,111 | $21,981 | $879 | $21,102 |
| 2021 | $1,118 | $21,980 | $880 | $21,100 |
| 2020 | $1,114 | $19,630 | $880 | $18,750 |
| 2019 | $1,072 | $21,980 | $880 | $21,100 |
| 2018 | $1,040 | $21,980 | $880 | $21,100 |
| 2017 | $797 | $21,980 | $880 | $21,100 |
| 2016 | $797 | $19,630 | $880 | $18,750 |
| 2015 | $815 | $19,630 | $880 | $18,750 |
| 2014 | $782 | $19,630 | $880 | $18,750 |
| 2013 | $697 | $19,630 | $880 | $18,750 |
Source: Public Records
Map
Nearby Homes
Your Personal Tour Guide
Ask me questions while you tour the home.