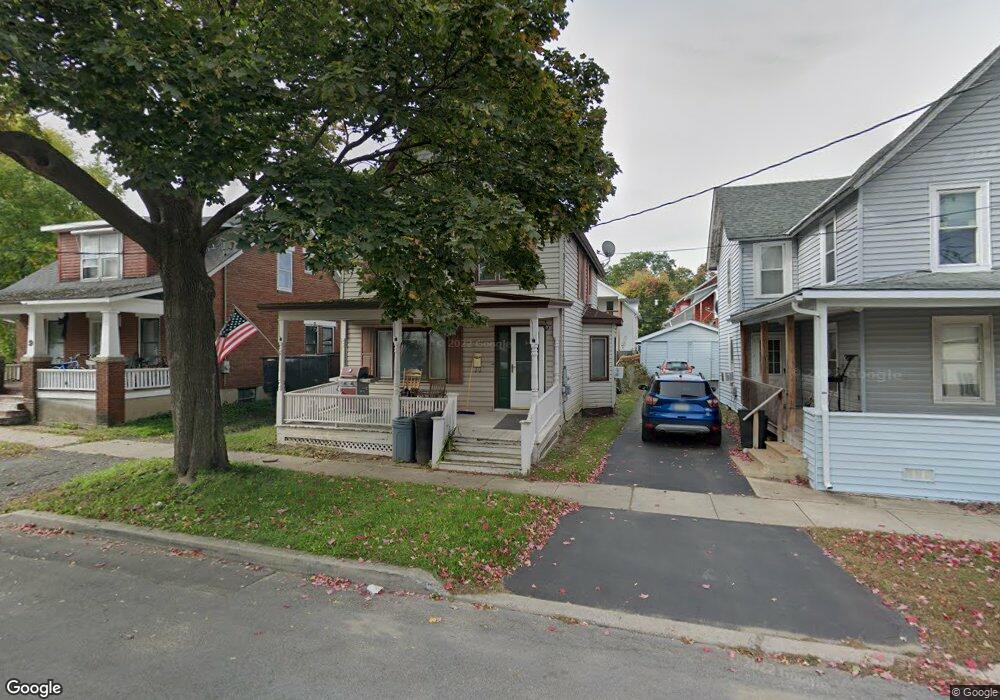
11 Champlain St Plattsburgh, NY 12901
Estimated Value: $172,000 - $234,000
3
Beds
2
Baths
1,401
Sq Ft
$139/Sq Ft
Est. Value
About This Home
This home is located at 11 Champlain St, Plattsburgh, NY 12901 and is currently estimated at $195,101, approximately $139 per square foot. 11 Champlain St is a home located in Clinton County with nearby schools including Thomas E. Glasgow Elementary School, Oak Street School, and Stafford Middle School.
Ownership History
Date
Name
Owned For
Owner Type
Purchase Details
Closed on
Jan 28, 2014
Sold by
Clark Kelly
Bought by
Lynch Nathanael M
Current Estimated Value
Home Financials for this Owner
Home Financials are based on the most recent Mortgage that was taken out on this home.
Original Mortgage
$98,188
Outstanding Balance
$72,383
Interest Rate
4.25%
Mortgage Type
FHA
Estimated Equity
$122,718
Purchase Details
Closed on
Oct 14, 2009
Sold by
Clark Kelly
Bought by
Clark Kelly
Purchase Details
Closed on
Aug 14, 2007
Sold by
Burnam Scott
Bought by
Clark Kelly
Home Financials for this Owner
Home Financials are based on the most recent Mortgage that was taken out on this home.
Original Mortgage
$87,550
Interest Rate
6.67%
Mortgage Type
Purchase Money Mortgage
Purchase Details
Closed on
Apr 10, 2003
Sold by
Annis Janice
Bought by
Burnam Scott
Purchase Details
Closed on
Dec 31, 2002
Sold by
Annis Janice
Bought by
Annis Robert
Purchase Details
Closed on
Dec 29, 2000
Sold by
Annis Janice
Bought by
Annis Robert
Create a Home Valuation Report for This Property
The Home Valuation Report is an in-depth analysis detailing your home's value as well as a comparison with similar homes in the area
Home Values in the Area
Average Home Value in this Area
Purchase History
| Date | Buyer | Sale Price | Title Company |
|---|---|---|---|
| Lynch Nathanael M | $100,000 | Joel Peller | |
| Clark Kelly | -- | Gary Favreau | |
| Clark Kelly | $85,000 | William Favreau | |
| Burnam Scott | $74,000 | Michael Thompson | |
| Annis Robert | -- | Gary L Favro | |
| Annis Robert | -- | Gary Favro |
Source: Public Records
Mortgage History
| Date | Status | Borrower | Loan Amount |
|---|---|---|---|
| Open | Lynch Nathanael M | $98,188 | |
| Previous Owner | Clark Kelly | $87,550 |
Source: Public Records
Tax History
| Year | Tax Paid | Tax Assessment Tax Assessment Total Assessment is a certain percentage of the fair market value that is determined by local assessors to be the total taxable value of land and additions on the property. | Land | Improvement |
|---|---|---|---|---|
| 2024 | $4,404 | $148,900 | $15,700 | $133,200 |
| 2023 | $4,215 | $148,900 | $15,700 | $133,200 |
| 2022 | $3,923 | $118,200 | $15,700 | $102,500 |
| 2021 | $4,046 | $118,200 | $15,700 | $102,500 |
| 2020 | $3,602 | $106,400 | $15,700 | $90,700 |
| 2019 | $1,814 | $106,400 | $15,700 | $90,700 |
| 2018 | $3,441 | $100,000 | $12,900 | $87,100 |
| 2017 | $1,796 | $100,000 | $12,900 | $87,100 |
| 2016 | $3,314 | $100,000 | $12,900 | $87,100 |
| 2015 | -- | $100,000 | $12,900 | $87,100 |
| 2014 | -- | $86,200 | $12,900 | $73,300 |
Source: Public Records
Map
Nearby Homes
- 13 Champlain St
- 9 Champlain St
- 15 Champlain St
- 3 Champlain St
- 14 Lafayette St
- 17 Champlain St
- 18 Lafayette St
- 10 Champlain St
- 6 Champlain St
- 148 Cornelia St
- 20 Lafayette St
- 4 Champlain St
- 16 Champlain St
- 21 Champlain St
- 146 Cornelia St
- 154 Cornelia St
- 22 Lafayette St
- 18 Champlain St
- 142 Cornelia St
- 19 Montcalm Ave
Your Personal Tour Guide
Ask me questions while you tour the home.