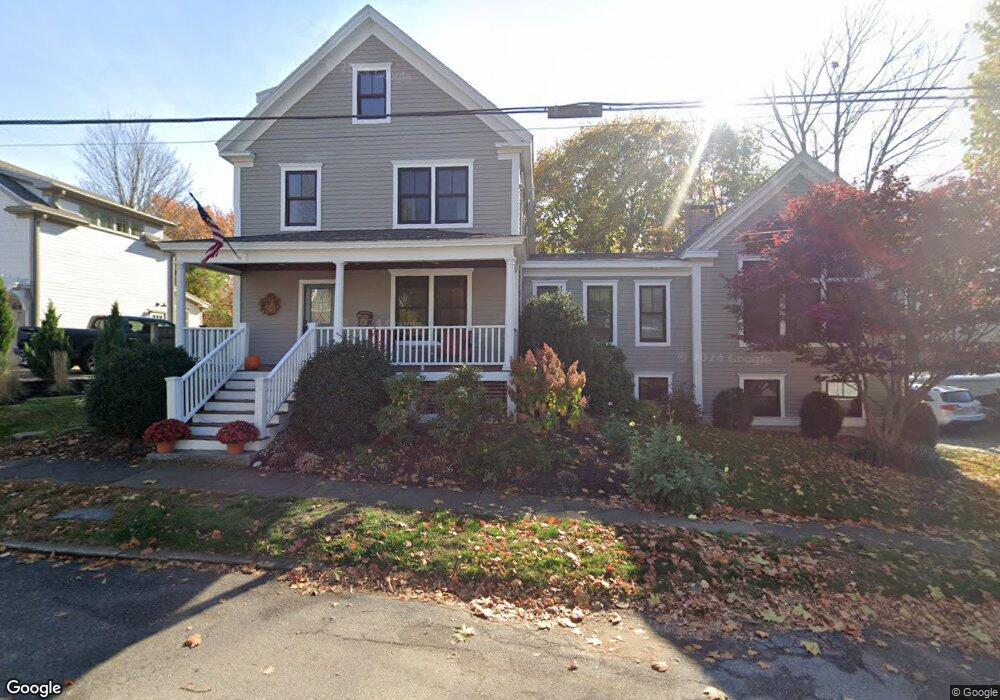
11 Chapel St Newburyport, MA 01950
Estimated Value: $1,042,000 - $1,995,309
3
Beds
1
Bath
1,616
Sq Ft
$1,010/Sq Ft
Est. Value
About This Home
This home is located at 11 Chapel St, Newburyport, MA 01950 and is currently estimated at $1,632,077, approximately $1,009 per square foot. 11 Chapel St is a home located in Essex County with nearby schools including Francis T. Bresnahan Elementary School, Edward G. Molin Elementary School, and Rupert A. Nock Middle School.
Ownership History
Date
Name
Owned For
Owner Type
Purchase Details
Closed on
Jan 31, 2007
Sold by
Collett Jr Tr James B and Tierney Thomas J
Bought by
Ellrott Thomas A and Ogasapian Nancy
Current Estimated Value
Home Financials for this Owner
Home Financials are based on the most recent Mortgage that was taken out on this home.
Original Mortgage
$350,000
Interest Rate
6.16%
Mortgage Type
Purchase Money Mortgage
Create a Home Valuation Report for This Property
The Home Valuation Report is an in-depth analysis detailing your home's value as well as a comparison with similar homes in the area
Home Values in the Area
Average Home Value in this Area
Purchase History
| Date | Buyer | Sale Price | Title Company |
|---|---|---|---|
| Ellrott Thomas A | $527,000 | -- |
Source: Public Records
Mortgage History
| Date | Status | Borrower | Loan Amount |
|---|---|---|---|
| Open | Ellrott Thomas A | $371,360 | |
| Closed | Ellrott Thomas A | $100,000 | |
| Closed | Ellrott Thomas A | $350,000 |
Source: Public Records
Tax History Compared to Growth
Tax History
| Year | Tax Paid | Tax Assessment Tax Assessment Total Assessment is a certain percentage of the fair market value that is determined by local assessors to be the total taxable value of land and additions on the property. | Land | Improvement |
|---|---|---|---|---|
| 2025 | $17,951 | $1,873,800 | $404,100 | $1,469,700 |
| 2024 | $17,033 | $1,708,400 | $367,300 | $1,341,100 |
| 2023 | $17,834 | $1,660,500 | $319,400 | $1,341,100 |
| 2022 | $16,892 | $1,406,500 | $266,100 | $1,140,400 |
| 2021 | $16,426 | $1,299,500 | $242,000 | $1,057,500 |
| 2020 | $16,073 | $1,251,800 | $242,000 | $1,009,800 |
| 2019 | $15,402 | $1,177,500 | $242,000 | $935,500 |
| 2018 | $17,127 | $1,291,600 | $230,500 | $1,061,100 |
| 2017 | $16,799 | $1,249,000 | $219,600 | $1,029,400 |
| 2016 | $14,698 | $1,097,700 | $209,100 | $888,600 |
| 2015 | $13,696 | $1,026,700 | $209,100 | $817,600 |
Source: Public Records
Map
Nearby Homes
- 287 1/2 High St
- 288 Merrimac St
- 13 Broad St
- 266 Merrimac St Unit F
- 19 Jefferson St
- 217 Merrimac St Unit 1
- 27 Warren St Unit 1
- 42 Myrtle Ave
- 138 Low St
- 17 Alberta Ave
- 110 Low St
- 6 Storey Ave
- 158 Merrimac St Unit 3
- 126 Merrimac St Unit 35
- 126 Merrimac St Unit 31
- 45 Boardman St Unit 1
- 14 Dexter Ln Unit B
- 14 Dexter Ln Unit A
- 41 Washington St Unit B
- 44 Washington St Unit C