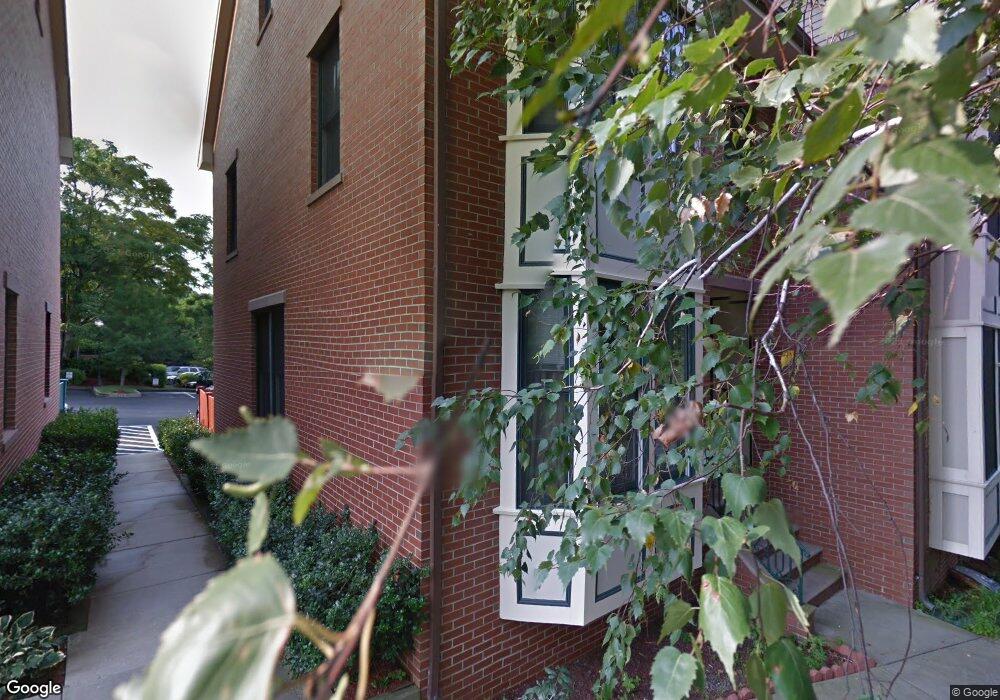
11 Charles St Charlestown, MA 02129
Medford Street-The Neck NeighborhoodEstimated Value: $1,613,000 - $2,114,254
3
Beds
4
Baths
1,686
Sq Ft
$1,086/Sq Ft
Est. Value
About This Home
This home is located at 11 Charles St, Charlestown, MA 02129 and is currently estimated at $1,831,064, approximately $1,086 per square foot. 11 Charles St is a home located in Suffolk County with nearby schools including Prospect Hill Academy Upper Elementary Campus and Bright Future Educare Center.
Ownership History
Date
Name
Owned For
Owner Type
Purchase Details
Closed on
Jun 5, 2018
Sold by
Charles Street Garden
Bought by
Celata Nicholas K
Current Estimated Value
Home Financials for this Owner
Home Financials are based on the most recent Mortgage that was taken out on this home.
Original Mortgage
$160,000
Outstanding Balance
$131,719
Interest Rate
4.4%
Mortgage Type
New Conventional
Estimated Equity
$1,699,345
Purchase Details
Closed on
Jul 31, 2009
Sold by
Auburn Street Llc
Bought by
Charles Street Garden
Purchase Details
Closed on
Jan 21, 2005
Sold by
Charles St Gardens Llc
Bought by
Auburn St Llc
Create a Home Valuation Report for This Property
The Home Valuation Report is an in-depth analysis detailing your home's value as well as a comparison with similar homes in the area
Home Values in the Area
Average Home Value in this Area
Purchase History
| Date | Buyer | Sale Price | Title Company |
|---|---|---|---|
| Celata Nicholas K | $240,000 | -- | |
| Charles Street Garden | -- | -- | |
| Auburn St Llc | -- | -- |
Source: Public Records
Mortgage History
| Date | Status | Borrower | Loan Amount |
|---|---|---|---|
| Open | Celata Nicholas K | $160,000 |
Source: Public Records
Tax History Compared to Growth
Tax History
| Year | Tax Paid | Tax Assessment Tax Assessment Total Assessment is a certain percentage of the fair market value that is determined by local assessors to be the total taxable value of land and additions on the property. | Land | Improvement |
|---|---|---|---|---|
| 2025 | $17,932 | $1,548,500 | $463,100 | $1,085,400 |
| 2024 | $16,341 | $1,499,200 | $415,100 | $1,084,100 |
| 2023 | $15,337 | $1,428,000 | $395,400 | $1,032,600 |
| 2022 | $14,001 | $1,286,900 | $359,400 | $927,500 |
| 2021 | $13,462 | $1,261,700 | $352,400 | $909,300 |
| 2020 | $11,812 | $1,118,600 | $347,900 | $770,700 |
| 2019 | $11,557 | $1,096,500 | $281,200 | $815,300 |
| 2018 | $10,845 | $1,034,800 | $281,200 | $753,600 |
| 2017 | $10,143 | $957,800 | $281,200 | $676,600 |
| 2016 | $9,893 | $899,400 | $281,400 | $618,000 |
| 2015 | $9,173 | $757,500 | $197,500 | $560,000 |
| 2014 | -- | $668,500 | $197,500 | $471,000 |
Source: Public Records
Map
Nearby Homes
- 9 Short St
- 100 Baldwin St Unit 1
- 40 Chappie St Unit 1
- 9 Armory St
- 364 Bunker Hill St Unit 1
- 24 N Mead St
- 29 Eden St Unit 3
- 56 Belmont St Unit 1
- 64 Walker St Unit 66
- 24 Brighton St
- 270 Bunker Hill St Unit 4
- 255 Bunker Hill St Unit 2
- 15 Russell St
- 9 Russell St Unit 2
- 9 Russell St Unit 1
- 19 Parker St Unit 3
- 39 Mount Pleasant St
- 207 Bunker Hill St Unit 2
- 254-256 Medford St Unit 2
- 7 Washington St