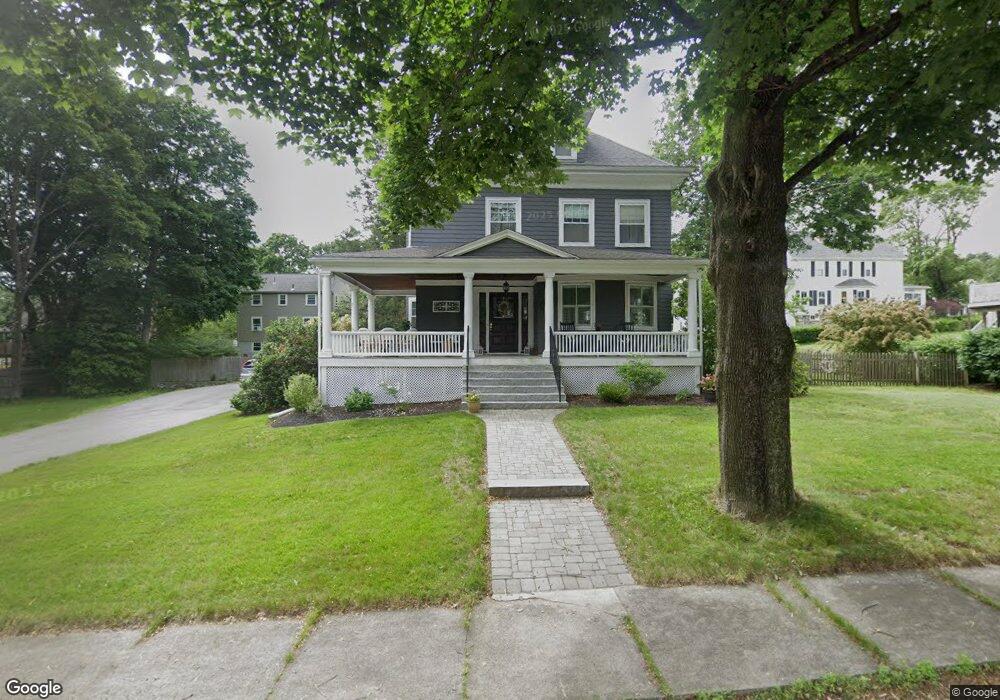
11 Charles St Walpole, MA 02081
Estimated Value: $818,000 - $985,000
5
Beds
2
Baths
2,711
Sq Ft
$334/Sq Ft
Est. Value
About This Home
This home is located at 11 Charles St, Walpole, MA 02081 and is currently estimated at $904,804, approximately $333 per square foot. 11 Charles St is a home located in Norfolk County with nearby schools including Boyden School, Eleanor N. Johnson Middle School, and Walpole High School.
Ownership History
Date
Name
Owned For
Owner Type
Purchase Details
Closed on
Sep 13, 2016
Sold by
Ross Kenneth R and Ross Maureen M
Bought by
Ross Rt
Current Estimated Value
Purchase Details
Closed on
Dec 10, 1999
Sold by
Beaudet Lucy A
Bought by
Ross Kenneth R and Ross Maureen M
Create a Home Valuation Report for This Property
The Home Valuation Report is an in-depth analysis detailing your home's value as well as a comparison with similar homes in the area
Home Values in the Area
Average Home Value in this Area
Purchase History
| Date | Buyer | Sale Price | Title Company |
|---|---|---|---|
| Ross Rt | -- | -- | |
| Ross Kenneth R | $280,000 | -- |
Source: Public Records
Mortgage History
| Date | Status | Borrower | Loan Amount |
|---|---|---|---|
| Previous Owner | Ross Kenneth R | $144,000 | |
| Previous Owner | Ross Kenneth R | $50,000 | |
| Previous Owner | Ross Kenneth R | $168,000 |
Source: Public Records
Tax History Compared to Growth
Tax History
| Year | Tax Paid | Tax Assessment Tax Assessment Total Assessment is a certain percentage of the fair market value that is determined by local assessors to be the total taxable value of land and additions on the property. | Land | Improvement |
|---|---|---|---|---|
| 2025 | $9,526 | $742,500 | $349,200 | $393,300 |
| 2024 | $9,637 | $729,000 | $335,700 | $393,300 |
| 2023 | $9,516 | $685,100 | $292,000 | $393,100 |
| 2022 | $8,852 | $612,200 | $270,400 | $341,800 |
| 2021 | $8,382 | $564,800 | $255,100 | $309,700 |
| 2020 | $7,876 | $525,400 | $240,700 | $284,700 |
| 2019 | $7,228 | $478,700 | $231,500 | $247,200 |
| 2018 | $7,094 | $464,600 | $223,000 | $241,600 |
| 2017 | $6,920 | $451,400 | $214,400 | $237,000 |
| 2016 | $6,596 | $423,900 | $206,100 | $217,800 |
| 2015 | $6,465 | $411,800 | $196,200 | $215,600 |
| 2014 | $6,181 | $392,200 | $196,200 | $196,000 |
Source: Public Records
Map
Nearby Homes
- 103 Centre Ln
- 305 Centre Ln
- 224 School St Unit 10
- 145 South St Unit 5
- 145 South St Unit 19
- 8 Autumn Ln
- 66 Oak St
- 8 Rainbow Pond Dr Unit 8
- 1156 Washington St
- 2213 Pennington Dr Unit 2213
- 4403 Pennington Dr Unit 4403
- 18 Teal Cir
- 24 Pelican Dr
- 52 Baker St
- 1391 Main St Unit 304
- 1391 Main St Unit 208
- 1391 Main St Unit 305
- 1391 Main St Unit 308
- 127 Clear Pond Dr
- 137 Clear Pond Dr