11 Charles Way Glen Head, NY 11545
Estimated Value: $2,773,604 - $3,153,000
--
Bed
4
Baths
5,431
Sq Ft
$546/Sq Ft
Est. Value
About This Home
This home is located at 11 Charles Way, Glen Head, NY 11545 and is currently estimated at $2,963,302, approximately $545 per square foot. 11 Charles Way is a home located in Nassau County with nearby schools including Locust Valley High School, Green Vale School, and Long Island Lutheran Middle & High School.
Ownership History
Date
Name
Owned For
Owner Type
Purchase Details
Closed on
Jun 14, 2024
Sold by
Uppal Baljit Singh and Marjit Kaur Family Trust
Bought by
Uppal Rajinder and Uppal Amarjit
Current Estimated Value
Home Financials for this Owner
Home Financials are based on the most recent Mortgage that was taken out on this home.
Original Mortgage
$833,000
Interest Rate
6.94%
Mortgage Type
New Conventional
Purchase Details
Closed on
Feb 29, 2024
Sold by
Uppal Baljit Singh and Amarjit Singh Uppal Family Trust
Bought by
Uppal Rajinder and Uppal Amarjit
Purchase Details
Closed on
Feb 2, 2023
Sold by
Uppal Rajinder and Uppal Amarjit
Bought by
Uppal Baljit Singh and Amarjit Kaur Uppal Family Trust
Create a Home Valuation Report for This Property
The Home Valuation Report is an in-depth analysis detailing your home's value as well as a comparison with similar homes in the area
Home Values in the Area
Average Home Value in this Area
Purchase History
| Date | Buyer | Sale Price | Title Company |
|---|---|---|---|
| Uppal Rajinder | -- | Judicial Title | |
| Uppal Rajinder | -- | Judicial Title | |
| Uppal Rajinder | -- | None Available | |
| Uppal Rajinder | -- | None Available | |
| Uppal Rajinder | -- | None Available | |
| Uppal Baljit Singh | -- | None Available | |
| Uppal Baljit Singh | -- | None Available | |
| Uppal Baljit Singh | -- | None Available |
Source: Public Records
Mortgage History
| Date | Status | Borrower | Loan Amount |
|---|---|---|---|
| Closed | Uppal Rajinder | $833,000 |
Source: Public Records
Tax History Compared to Growth
Tax History
| Year | Tax Paid | Tax Assessment Tax Assessment Total Assessment is a certain percentage of the fair market value that is determined by local assessors to be the total taxable value of land and additions on the property. | Land | Improvement |
|---|---|---|---|---|
| 2025 | $35,728 | $1,823 | $699 | $1,124 |
| 2024 | $5,012 | $1,720 | $633 | $1,087 |
| 2023 | $31,110 | $1,900 | $699 | $1,201 |
| 2022 | $31,110 | $1,900 | $699 | $1,201 |
| 2021 | $27,597 | $2,005 | $738 | $1,267 |
| 2020 | $26,748 | $2,660 | $1,888 | $772 |
| 2019 | $28,159 | $2,805 | $1,991 | $814 |
| 2018 | $27,958 | $2,890 | $0 | $0 |
| 2017 | $21,505 | $2,890 | $1,783 | $1,107 |
| 2016 | $26,629 | $3,177 | $1,661 | $1,516 |
| 2015 | $4,982 | $3,325 | $1,738 | $1,587 |
| 2014 | $4,982 | $3,325 | $1,738 | $1,587 |
| 2013 | $5,503 | $3,924 | $2,051 | $1,873 |
Source: Public Records
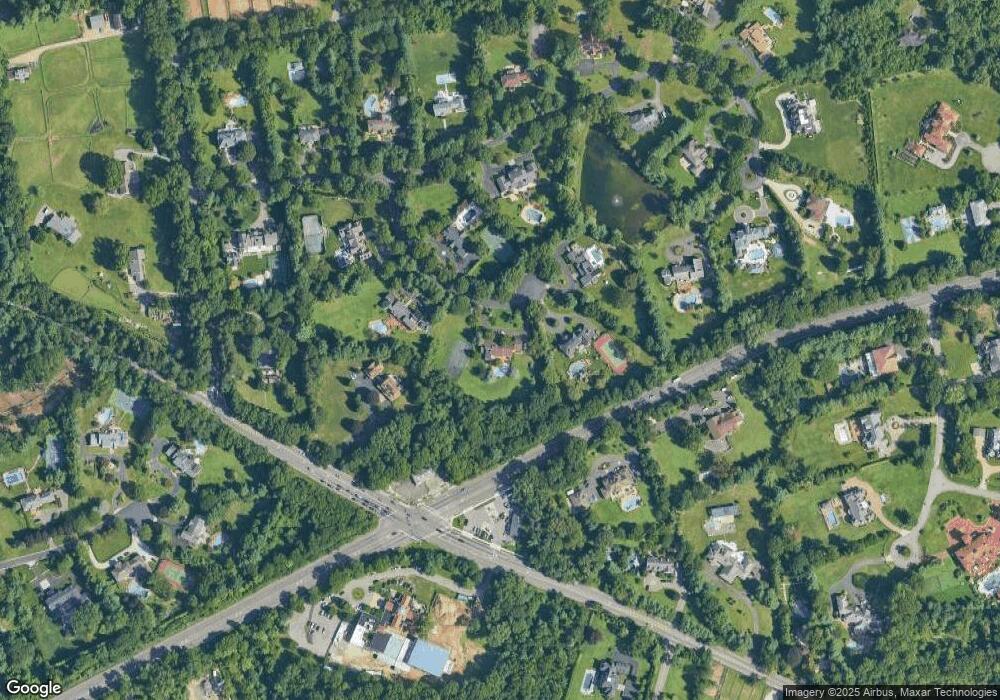
Map
Nearby Homes
- 34 Glen Cove Dr
- 21 Overbrook Ln
- 0 High Point Lot A Ct Unit KEYL3464991
- 2340 A Cedar Swamp Rd
- 5 Carol Ln
- 5 Farmwoods Ln
- 5 Peacock Ln
- 16 Horse Hill Rd
- 170 Hegemans Ln
- 172 Hegemans Ln
- 168 Hegemans Ln
- 1629 Cedar Swamp Rd
- 183 Linden Ln
- 1622 Old Cedar Swamp Rd
- 12 Hickory Dr
- 12 Ridge Ct
- 8 Norgate Rd
- 8 Rolling Dr
- 35 Hoaglands Ln
- 8 High Meadow Ct
- 12 Charles Way
- 9 Charles Way
- 1297 Cedar Swamp Rd
- 15 Charles Way
- 15 Charles Way
- 8 Charles Way
- 5055 Northern Blvd
- 5900 Northern Blvd
- 5100 Northern Blvd
- 19 Overbrook Ln
- 7 Charles Way
- 25 Overbrook Ln
- 25 Overbrook Ln
- 10 Hegemans Ln
- 57 East Ave
- 0 High Farms Rd Unit 3069583
- 66 Nassau Ave
- 225 Lawrence
- 22 Private Rd
- 88 Swan Ct