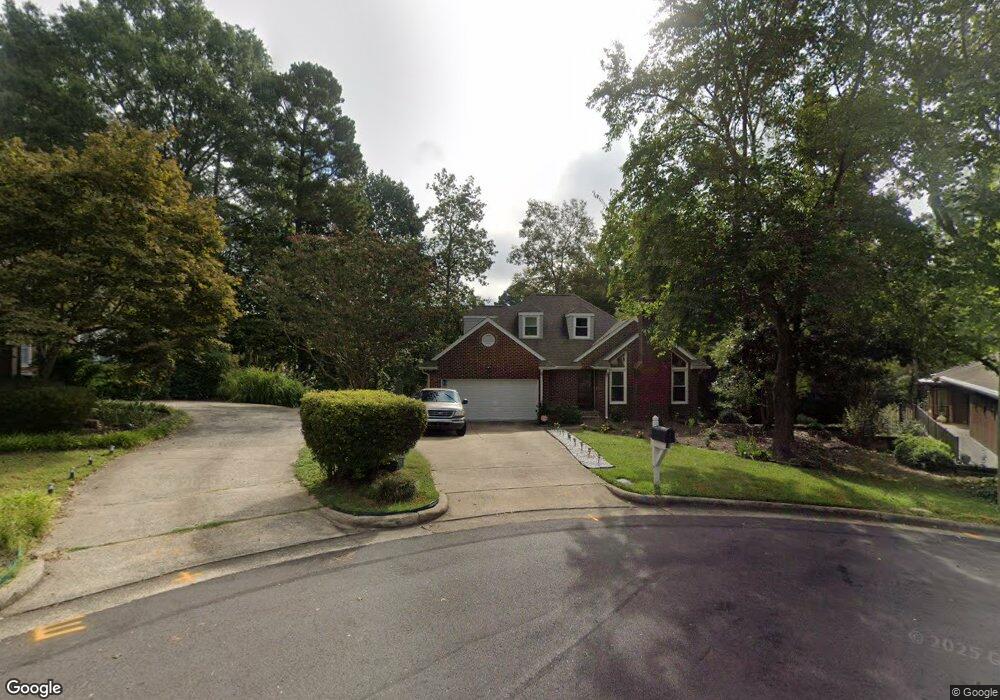
11 Chartwell Ct Durham, NC 27703
Eastern Durham NeighborhoodEstimated Value: $374,784 - $412,000
3
Beds
3
Baths
1,800
Sq Ft
$221/Sq Ft
Est. Value
About This Home
This home is located at 11 Chartwell Ct, Durham, NC 27703 and is currently estimated at $397,196, approximately $220 per square foot. 11 Chartwell Ct is a home located in Durham County with nearby schools including Oak Grove Elementary, John W Neal Middle School, and Southern School of Energy & Sustainability.
Ownership History
Date
Name
Owned For
Owner Type
Purchase Details
Closed on
Nov 1, 2010
Sold by
Morris Aaron H and Morris Priscila
Bought by
Caston Michael J and Caston Gwendolyn
Current Estimated Value
Home Financials for this Owner
Home Financials are based on the most recent Mortgage that was taken out on this home.
Original Mortgage
$180,750
Outstanding Balance
$119,923
Interest Rate
4.38%
Mortgage Type
VA
Estimated Equity
$277,273
Purchase Details
Closed on
Jun 28, 2002
Sold by
Girardi Richard S and Girardi Kristen M
Bought by
Morris Aaron H
Home Financials for this Owner
Home Financials are based on the most recent Mortgage that was taken out on this home.
Original Mortgage
$134,400
Interest Rate
6.86%
Create a Home Valuation Report for This Property
The Home Valuation Report is an in-depth analysis detailing your home's value as well as a comparison with similar homes in the area
Home Values in the Area
Average Home Value in this Area
Purchase History
| Date | Buyer | Sale Price | Title Company |
|---|---|---|---|
| Caston Michael J | $175,000 | None Available | |
| Morris Aaron H | $168,000 | -- |
Source: Public Records
Mortgage History
| Date | Status | Borrower | Loan Amount |
|---|---|---|---|
| Open | Caston Michael J | $180,750 | |
| Previous Owner | Morris Aaron H | $134,400 | |
| Closed | Morris Aaron H | $16,800 |
Source: Public Records
Tax History
| Year | Tax Paid | Tax Assessment Tax Assessment Total Assessment is a certain percentage of the fair market value that is determined by local assessors to be the total taxable value of land and additions on the property. | Land | Improvement |
|---|---|---|---|---|
| 2025 | $3,708 | $374,037 | $65,840 | $308,197 |
| 2024 | $3,051 | $218,737 | $45,457 | $173,280 |
| 2023 | $2,865 | $218,737 | $45,457 | $173,280 |
| 2022 | $2,800 | $218,737 | $45,457 | $173,280 |
| 2021 | $2,786 | $218,737 | $45,457 | $173,280 |
| 2020 | $2,721 | $218,737 | $45,457 | $173,280 |
| 2019 | $2,721 | $218,737 | $45,457 | $173,280 |
| 2018 | $2,711 | $199,817 | $35,090 | $164,727 |
| 2017 | $2,691 | $199,817 | $35,090 | $164,727 |
| 2016 | $2,600 | $199,817 | $35,090 | $164,727 |
| 2015 | $2,545 | $183,848 | $40,224 | $143,624 |
| 2014 | $2,545 | $183,848 | $40,224 | $143,624 |
Source: Public Records
Map
Nearby Homes
- 3 Chartwell Ct
- 505 Nichols Farm Dr
- 110 Kindlewood Dr
- 510 Oak Grove Pkwy
- 107 Crosswood Dr
- 501 Bellmeade Bay Dr
- 601 Crossing Dr
- 615 Southshore Pkwy
- 604 Bellmeade Bay Dr
- 442 Gus Rd
- 201 Lanier Valley Dr
- 3804 Valleydale Dr
- 1104 Gunston Ln
- 2800-2809 Napoli Dr
- 604 Crossview Ln
- 707 Painted Daisy Ln
- 528 Plumleaf Ln
- 505 Plumleaf Ln
- 217 Morning View Ct
- 503 Plumleaf Ln
- 6 Mooring Ct
- 12 Chartwell Ct
- 9 Chartwell Ct
- 4 Mooring Ct
- 7 Mooring Ct
- 10 Chartwell Ct
- 2 Mooring Ct
- 8 Chartwell Ct
- 7 Chartwell Ct
- 110 Lick Creek Ln
- 7 Kings Grant Ct
- 5 Mooring Ct
- 6 Chartwell Ct
- 108 Lick Creek Ln
- 5 Kings Grant Ct
- 3 Mooring Ct
- 8 Kings Grant Ct
- 5 Chartwell Ct
- 1 Mooring Ct
- 8 Kings Grant Ct
Your Personal Tour Guide
Ask me questions while you tour the home.