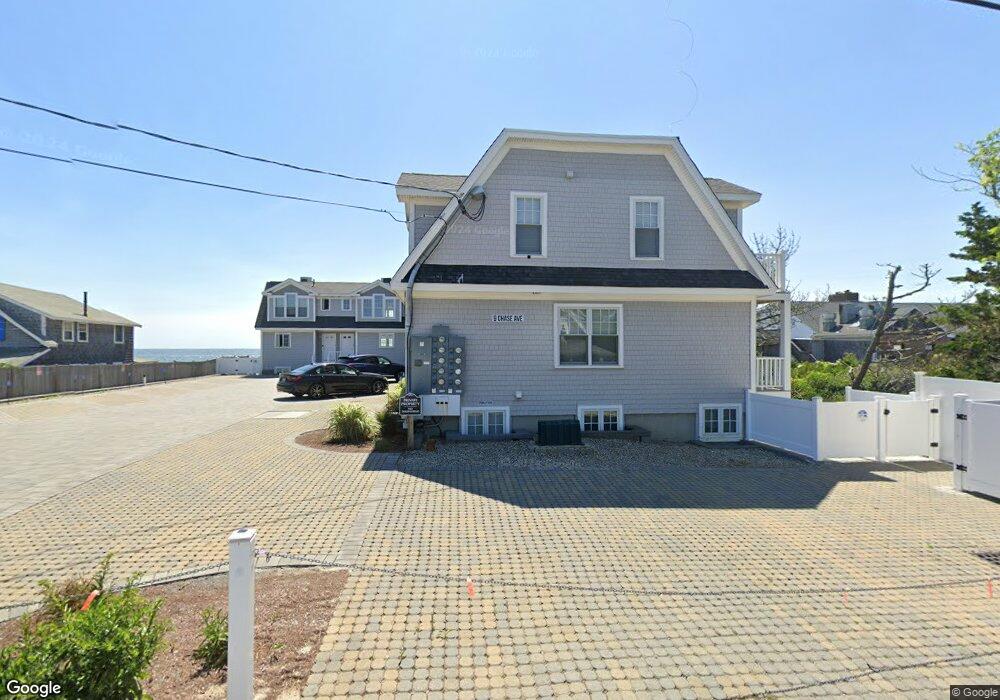
11 Chase Ave Dennis Port, MA 02639
Dennis Port NeighborhoodEstimated Value: $766,920 - $861,000
3
Beds
2
Baths
1,306
Sq Ft
$629/Sq Ft
Est. Value
About This Home
This home is located at 11 Chase Ave, Dennis Port, MA 02639 and is currently estimated at $820,980, approximately $628 per square foot. 11 Chase Ave is a home located in Barnstable County with nearby schools including Dennis-Yarmouth Regional High School and St. Pius X. School.
Ownership History
Date
Name
Owned For
Owner Type
Purchase Details
Closed on
Mar 26, 2010
Sold by
Bakos Stephen F and Rege Carole
Bought by
Hurley Keith F and Hurley Doreen K
Current Estimated Value
Home Financials for this Owner
Home Financials are based on the most recent Mortgage that was taken out on this home.
Original Mortgage
$296,000
Outstanding Balance
$195,804
Interest Rate
5.02%
Mortgage Type
Purchase Money Mortgage
Estimated Equity
$625,176
Create a Home Valuation Report for This Property
The Home Valuation Report is an in-depth analysis detailing your home's value as well as a comparison with similar homes in the area
Home Values in the Area
Average Home Value in this Area
Purchase History
| Date | Buyer | Sale Price | Title Company |
|---|---|---|---|
| Hurley Keith F | $370,000 | -- | |
| Hurley Keith F | $370,000 | -- |
Source: Public Records
Mortgage History
| Date | Status | Borrower | Loan Amount |
|---|---|---|---|
| Open | Hurley Keith F | $296,000 | |
| Closed | Hurley Keith F | $296,000 |
Source: Public Records
Tax History Compared to Growth
Tax History
| Year | Tax Paid | Tax Assessment Tax Assessment Total Assessment is a certain percentage of the fair market value that is determined by local assessors to be the total taxable value of land and additions on the property. | Land | Improvement |
|---|---|---|---|---|
| 2025 | $2,725 | $629,400 | $264,500 | $364,900 |
| 2024 | $2,627 | $598,400 | $254,300 | $344,100 |
| 2023 | $2,511 | $537,700 | $224,800 | $312,900 |
| 2022 | $2,533 | $452,400 | $219,800 | $232,600 |
| 2021 | $2,411 | $399,900 | $215,500 | $184,400 |
| 2020 | $2,724 | $446,600 | $238,200 | $208,400 |
| 2019 | $2,174 | $352,300 | $166,800 | $185,500 |
| 2018 | $2,547 | $401,800 | $222,300 | $179,500 |
| 2017 | $2,146 | $348,900 | $169,400 | $179,500 |
| 2016 | $2,280 | $349,200 | $195,900 | $153,300 |
| 2015 | $2,235 | $349,200 | $195,900 | $153,300 |
| 2014 | $1,984 | $312,500 | $164,100 | $148,400 |
Source: Public Records
Map
Nearby Homes
- 102 Sea St
- 12 Cross St
- 26 Manning Rd
- 402 Old Wharf Rd
- 402 Old Wharf Rd
- 11 Ocean Park W
- 405 Old Wharf Rd Unit B204
- 405 Old Wharf Rd Unit B204
- 22 Ferncliff Rd
- 159 Center St Unit 22
- 9 Chase Ave Unit 6
- 37-A Beach Hills Rd
- 1 E Belmont Unit 630
- 37 Beach Hills Rd
- 73 Division St
- 1 Belmont Rd Unit 630
- 1 Belmont Rd Unit 513
- 10 Candlewood Ln Unit 2-1
- 12 Candlewood Ln Unit 2-9
- 262 Old Wharf Rd Unit 67