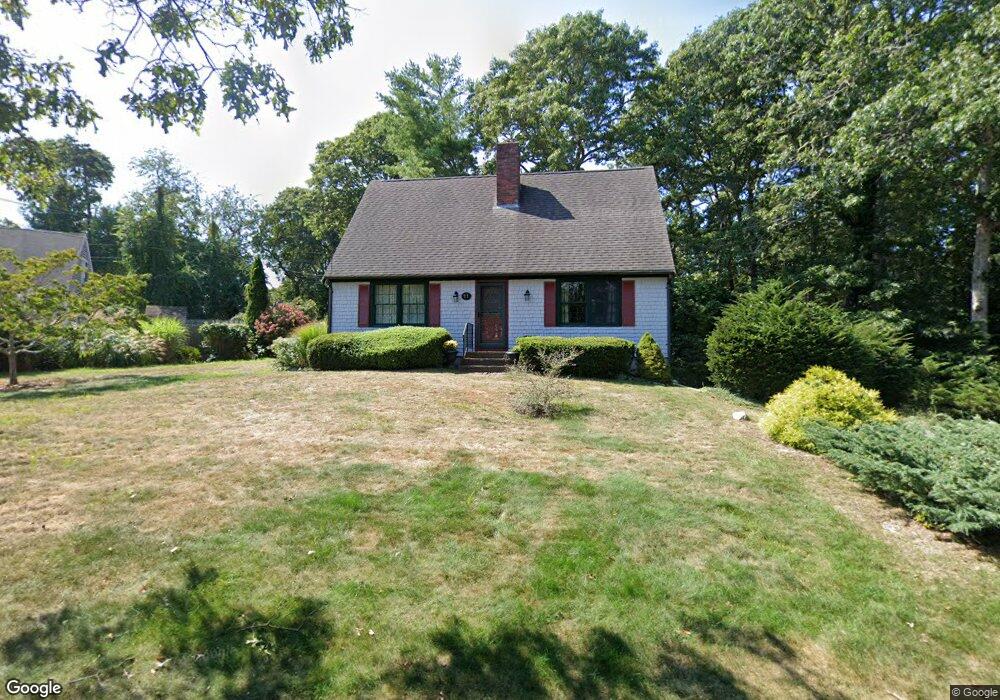
11 Cheyenne Ln Yarmouth Port, MA 02675
Yarmouth Port NeighborhoodEstimated Value: $584,626 - $701,000
3
Beds
3
Baths
1,296
Sq Ft
$508/Sq Ft
Est. Value
About This Home
This home is located at 11 Cheyenne Ln, Yarmouth Port, MA 02675 and is currently estimated at $658,907, approximately $508 per square foot. 11 Cheyenne Ln is a home located in Barnstable County with nearby schools including Dennis-Yarmouth Regional High School, St. Pius X. School, and Trinity Christian Academy of Cape Cod.
Ownership History
Date
Name
Owned For
Owner Type
Purchase Details
Closed on
Aug 8, 2005
Sold by
Mary Jane Edlund T and Edlund Mary J
Bought by
Edlund Christa and Lasalle Joel A
Current Estimated Value
Home Financials for this Owner
Home Financials are based on the most recent Mortgage that was taken out on this home.
Original Mortgage
$120,000
Outstanding Balance
$62,916
Interest Rate
5.63%
Mortgage Type
Purchase Money Mortgage
Estimated Equity
$595,991
Create a Home Valuation Report for This Property
The Home Valuation Report is an in-depth analysis detailing your home's value as well as a comparison with similar homes in the area
Home Values in the Area
Average Home Value in this Area
Purchase History
| Date | Buyer | Sale Price | Title Company |
|---|---|---|---|
| Edlund Christa | $120,000 | -- |
Source: Public Records
Mortgage History
| Date | Status | Borrower | Loan Amount |
|---|---|---|---|
| Open | Edlund Christa | $120,000 |
Source: Public Records
Tax History Compared to Growth
Tax History
| Year | Tax Paid | Tax Assessment Tax Assessment Total Assessment is a certain percentage of the fair market value that is determined by local assessors to be the total taxable value of land and additions on the property. | Land | Improvement |
|---|---|---|---|---|
| 2025 | $3,767 | $532,100 | $165,300 | $366,800 |
| 2024 | $3,490 | $472,900 | $143,800 | $329,100 |
| 2023 | $3,473 | $428,200 | $130,700 | $297,500 |
| 2022 | $3,207 | $349,400 | $124,700 | $224,700 |
| 2021 | $3,160 | $330,500 | $124,700 | $205,800 |
| 2020 | $3,446 | $313,000 | $132,000 | $181,000 |
| 2019 | $3,289 | $291,200 | $132,000 | $159,200 |
| 2018 | $2,770 | $269,200 | $110,000 | $159,200 |
| 2017 | $3,032 | $269,200 | $110,000 | $159,200 |
| 2016 | $2,599 | $260,400 | $101,200 | $159,200 |
| 2015 | $2,439 | $242,900 | $96,800 | $146,100 |
Source: Public Records
Map
Nearby Homes
- 8 Rowley Ln
- 209 Union St
- 32 Deveau Ln
- 1 Barnacle Rd
- 16 Warren Rd Unit 16
- 16 Warren Rd
- 86 Pompano Rd
- 24 Minnetuxet Way
- 882 W Yarmouth Rd
- 933-935 W Yarmouth Rd
- 34 Ridgewood Dr
- 25 Oak Glen
- 25 Oak Glen Village Unit 25
- 43 Canterbury Rd
- 0 Forsyth Ave
- 44 Stratford Ln
- 2 Pine Grove
- 10 Balsam Way
- 50 Cottonwood St
- 23 Dauphine Dr