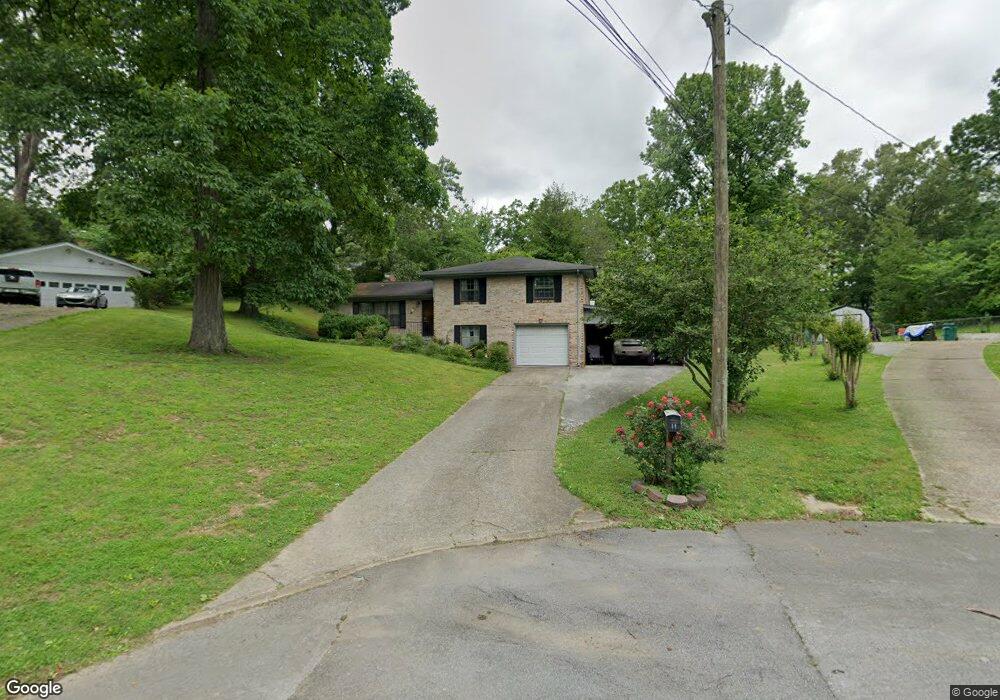
11 Cindy Cir Fort Oglethorpe, GA 30742
Estimated Value: $196,571 - $250,000
--
Bed
2
Baths
1,304
Sq Ft
$171/Sq Ft
Est. Value
About This Home
This home is located at 11 Cindy Cir, Fort Oglethorpe, GA 30742 and is currently estimated at $222,643, approximately $170 per square foot. 11 Cindy Cir is a home located in Catoosa County with nearby schools including Battlefield Primary School, Battlefield Elementary School, and Lakeview Middle School.
Ownership History
Date
Name
Owned For
Owner Type
Purchase Details
Closed on
Oct 13, 2017
Sold by
Hubbs Randall M
Bought by
Hubbs Randall M and Hubbs Linda D
Current Estimated Value
Home Financials for this Owner
Home Financials are based on the most recent Mortgage that was taken out on this home.
Original Mortgage
$120,650
Outstanding Balance
$102,304
Interest Rate
4.4%
Mortgage Type
FHA
Estimated Equity
$120,339
Purchase Details
Closed on
Jan 31, 1990
Bought by
Hubbs Randy M And
Create a Home Valuation Report for This Property
The Home Valuation Report is an in-depth analysis detailing your home's value as well as a comparison with similar homes in the area
Home Values in the Area
Average Home Value in this Area
Purchase History
| Date | Buyer | Sale Price | Title Company |
|---|---|---|---|
| Hubbs Randall M | -- | -- | |
| Hubbs Randy M And | $55,000 | -- |
Source: Public Records
Mortgage History
| Date | Status | Borrower | Loan Amount |
|---|---|---|---|
| Open | Hubbs Randall M | $120,650 |
Source: Public Records
Tax History Compared to Growth
Tax History
| Year | Tax Paid | Tax Assessment Tax Assessment Total Assessment is a certain percentage of the fair market value that is determined by local assessors to be the total taxable value of land and additions on the property. | Land | Improvement |
|---|---|---|---|---|
| 2024 | $1,742 | $76,537 | $11,633 | $64,904 |
| 2023 | $1,393 | $60,381 | $11,633 | $48,748 |
| 2022 | $1,060 | $48,509 | $11,633 | $36,876 |
| 2021 | $992 | $48,509 | $11,633 | $36,876 |
| 2020 | $1,300 | $44,035 | $11,633 | $32,402 |
| 2019 | $975 | $44,035 | $11,633 | $32,402 |
| 2018 | $1,286 | $41,047 | $10,341 | $30,706 |
| 2017 | $933 | $40,941 | $10,341 | $30,600 |
| 2016 | $908 | $38,382 | $10,341 | $28,042 |
| 2015 | -- | $38,382 | $10,341 | $28,042 |
| 2014 | -- | $38,382 | $10,341 | $28,042 |
| 2013 | -- | $38,382 | $10,340 | $28,041 |
Source: Public Records
Map
Nearby Homes