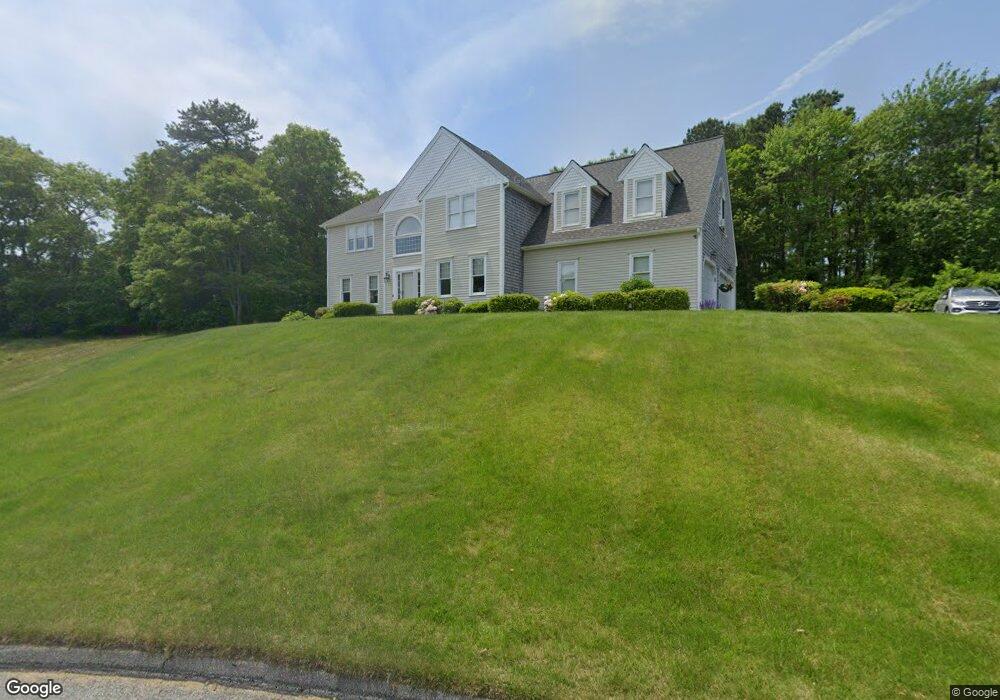
11 Clapp Ln Sagamore Beach, MA 02562
Estimated Value: $971,000 - $1,539,000
1
Bed
1
Bath
575
Sq Ft
$2,016/Sq Ft
Est. Value
About This Home
This home is located at 11 Clapp Ln, Sagamore Beach, MA 02562 and is currently estimated at $1,159,319, approximately $2,016 per square foot. 11 Clapp Ln is a home located in Barnstable County with nearby schools including Bourne High School, New Testament Christian School, and Bridgeview Montessori School.
Ownership History
Date
Name
Owned For
Owner Type
Purchase Details
Closed on
Sep 2, 1998
Sold by
Chilinski Frank G and Chilinski Barbara Rios
Bought by
Ames Linda
Current Estimated Value
Purchase Details
Closed on
Jan 30, 1998
Sold by
Sagamore Highlands Rt and Dickey William R
Bought by
Chilinski Frank G and Chilinski Barbara Rios
Home Financials for this Owner
Home Financials are based on the most recent Mortgage that was taken out on this home.
Original Mortgage
$189,600
Interest Rate
7.02%
Mortgage Type
Purchase Money Mortgage
Purchase Details
Closed on
Aug 17, 1994
Sold by
Earles Rt and Clapp Roger E
Bought by
Sagamore Hts Rt and Dickey William R
Create a Home Valuation Report for This Property
The Home Valuation Report is an in-depth analysis detailing your home's value as well as a comparison with similar homes in the area
Home Values in the Area
Average Home Value in this Area
Purchase History
| Date | Buyer | Sale Price | Title Company |
|---|---|---|---|
| Ames Linda | $238,000 | -- | |
| Ames Linda | $238,000 | -- | |
| Chilinski Frank G | $237,000 | -- | |
| Chilinski Frank G | $237,000 | -- | |
| Sagamore Hts Rt | $40,000 | -- | |
| Sagamore Hts Rt | $40,000 | -- |
Source: Public Records
Mortgage History
| Date | Status | Borrower | Loan Amount |
|---|---|---|---|
| Previous Owner | Sagamore Hts Rt | $189,600 | |
| Previous Owner | Sagamore Hts Rt | $33,600 |
Source: Public Records
Tax History
| Year | Tax Paid | Tax Assessment Tax Assessment Total Assessment is a certain percentage of the fair market value that is determined by local assessors to be the total taxable value of land and additions on the property. | Land | Improvement |
|---|---|---|---|---|
| 2025 | $7,136 | $913,700 | $219,200 | $694,500 |
| 2024 | $6,594 | $822,200 | $208,700 | $613,500 |
| 2023 | $6,410 | $727,600 | $184,700 | $542,900 |
| 2022 | $5,996 | $594,300 | $163,500 | $430,800 |
| 2021 | $3,947 | $545,700 | $148,800 | $396,900 |
| 2020 | $5,772 | $537,400 | $147,400 | $390,000 |
| 2019 | $3,850 | $515,400 | $147,400 | $368,000 |
| 2018 | $4,974 | $471,900 | $140,400 | $331,500 |
| 2017 | $3,142 | $463,200 | $139,000 | $324,200 |
| 2016 | $4,628 | $455,500 | $139,000 | $316,500 |
| 2015 | $4,460 | $442,900 | $126,400 | $316,500 |
Source: Public Records
Map
Nearby Homes
- 17 Ridgehill Ln
- 11 Village Green Dr Unit B
- 10 Tecumseh Rd
- 0 State Rd
- 8 Driftwood Ln
- 30 Pawtuxet Rd
- 40 Menotomy Rd
- 133 Phillips Rd
- 92 Cliffside Dr Unit hole 2
- 16 Ocean Pines Dr Unit B
- 80 Fairway Dr
- 4 Andrew Rd
- 38 Siasconset Dr
- 31 Monisa Kay Dr
- 110 Valley Rd
- 53 Carters Bridge Rd
- 10 Shore Rd
- 11 Womponoag Rd
- 2 Womponoag Rd
- 9 Headlands Dr
Your Personal Tour Guide
Ask me questions while you tour the home.