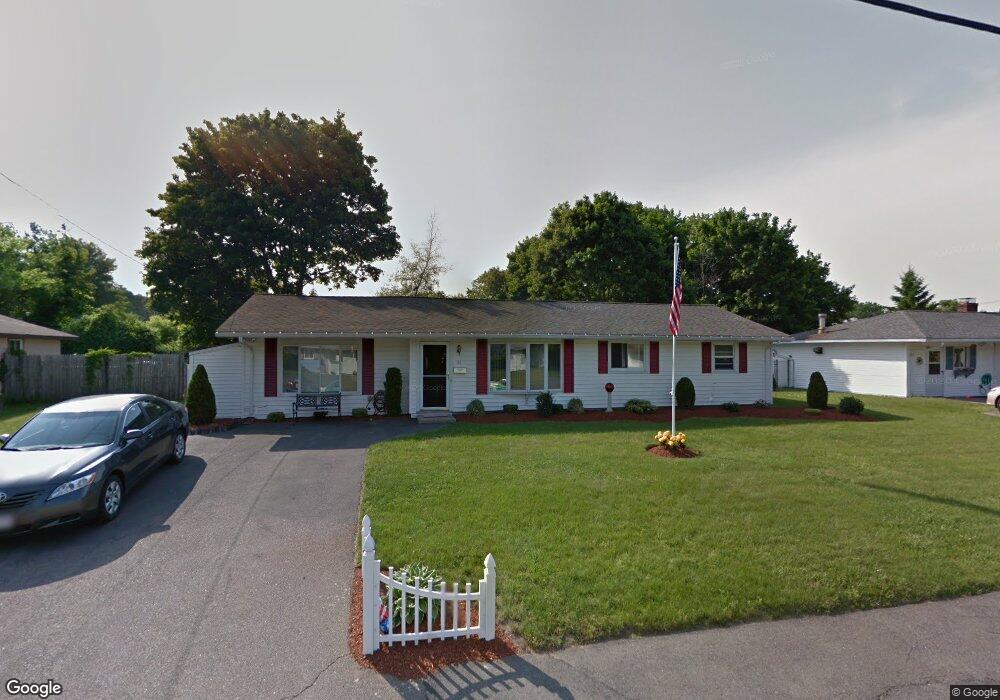
11 Clara Rd Holbrook, MA 02343
Estimated Value: $507,541 - $561,000
4
Beds
2
Baths
1,360
Sq Ft
$389/Sq Ft
Est. Value
About This Home
This home is located at 11 Clara Rd, Holbrook, MA 02343 and is currently estimated at $528,885, approximately $388 per square foot. 11 Clara Rd is a home located in Norfolk County with nearby schools including John F. Kennedy Elementary School, Holbrook Middle High School, and Boston Higashi School.
Ownership History
Date
Name
Owned For
Owner Type
Purchase Details
Closed on
Mar 10, 2020
Sold by
Verlicco Edward H and Verlicco Marie
Bought by
Verlicco Edward H and Verlicco Marie
Current Estimated Value
Purchase Details
Closed on
Dec 13, 2007
Sold by
11 Clara Road Rt and Duggan
Bought by
Verlicco Edward H and Oliver Marie E
Home Financials for this Owner
Home Financials are based on the most recent Mortgage that was taken out on this home.
Original Mortgage
$260,000
Interest Rate
6.3%
Mortgage Type
Purchase Money Mortgage
Purchase Details
Closed on
Sep 21, 2007
Sold by
Hsbc Bank Usa and Fieldstone Mortgage In
Bought by
11 Clara Road Rt and Duggan
Home Financials for this Owner
Home Financials are based on the most recent Mortgage that was taken out on this home.
Original Mortgage
$156,000
Interest Rate
6.63%
Mortgage Type
Purchase Money Mortgage
Purchase Details
Closed on
Sep 10, 2007
Sold by
Elfman Janean T and Hsbc Bank Usa
Bought by
Hsbc Bank Usa
Home Financials for this Owner
Home Financials are based on the most recent Mortgage that was taken out on this home.
Original Mortgage
$156,000
Interest Rate
6.63%
Mortgage Type
Purchase Money Mortgage
Purchase Details
Closed on
Dec 17, 2004
Sold by
Hennessey Daniel J and Hennessey Kimberly F
Bought by
Elfman Janean T and Mcdonald John R
Purchase Details
Closed on
Oct 4, 2002
Sold by
Desouza Kenneth S and Desouza Kelly S
Bought by
Hunt Kimberly F
Purchase Details
Closed on
Apr 21, 1998
Sold by
Greenberg Sylvia
Bought by
Desouza Kenneth S and Desouza Kelly S
Create a Home Valuation Report for This Property
The Home Valuation Report is an in-depth analysis detailing your home's value as well as a comparison with similar homes in the area
Home Values in the Area
Average Home Value in this Area
Purchase History
| Date | Buyer | Sale Price | Title Company |
|---|---|---|---|
| Verlicco Edward H | -- | None Available | |
| Verlicco Edward H | -- | None Available | |
| Verlicco Edward H | -- | None Available | |
| Verlicco Edward H | $280,000 | -- | |
| Verlicco Edward H | $280,000 | -- | |
| Verlicco Edward H | $280,000 | -- | |
| 11 Clara Road Rt | $208,000 | -- | |
| 11 Clara Road Rt | $208,000 | -- | |
| 11 Clara Road Rt | $208,000 | -- | |
| Hsbc Bank Usa | -- | -- | |
| Hsbc Bank Usa | -- | -- | |
| Hsbc Bank Usa | $261,146 | -- | |
| Hsbc Bank Usa | $261,146 | -- | |
| Hsbc Bank Usa | $261,146 | -- | |
| Elfman Janean T | $302,400 | -- | |
| Elfman Janean T | $302,400 | -- | |
| Hunt Kimberly F | $259,900 | -- | |
| Hunt Kimberly F | $259,900 | -- | |
| Desouza Kenneth S | $126,200 | -- | |
| Desouza Kenneth S | $126,200 | -- |
Source: Public Records
Mortgage History
| Date | Status | Borrower | Loan Amount |
|---|---|---|---|
| Previous Owner | Verlicco Edward H | $260,000 | |
| Previous Owner | 11 Clara Road Rt | $156,000 |
Source: Public Records
Tax History
| Year | Tax Paid | Tax Assessment Tax Assessment Total Assessment is a certain percentage of the fair market value that is determined by local assessors to be the total taxable value of land and additions on the property. | Land | Improvement |
|---|---|---|---|---|
| 2025 | $58 | $443,800 | $248,200 | $195,600 |
| 2024 | $5,540 | $412,200 | $225,600 | $186,600 |
| 2023 | $5,866 | $381,400 | $205,200 | $176,200 |
| 2022 | $5,433 | $329,500 | $178,400 | $151,100 |
| 2021 | $5,278 | $306,500 | $163,400 | $143,100 |
| 2020 | $5,309 | $289,000 | $152,800 | $136,200 |
| 2019 | $5,352 | $275,000 | $145,500 | $129,500 |
| 2018 | $5,269 | $254,900 | $130,000 | $124,900 |
| 2017 | $4,987 | $238,600 | $118,300 | $120,300 |
| 2016 | $4,551 | $231,700 | $118,300 | $113,400 |
| 2015 | $4,095 | $214,600 | $106,700 | $107,900 |
| 2014 | $3,756 | $200,100 | $97,000 | $103,100 |
Source: Public Records
Map
Nearby Homes
- 360 Plymouth St
- 45-R Ernest St
- 63 Sycamore St
- 88 Roseen Rd
- 181 S Franklin St Unit 102
- 181 S Franklin St Unit 206
- 152 S Franklin St
- 35 Marion St
- 123-125 N Franklin St
- 58 Chandler St
- 95 Rindone St
- 184 Belcher St
- 375 S Franklin St Unit 1
- 36 Summer St
- 27 Winter St
- 24 Reeds Ln
- 278 N Franklin St
- 5 Clarendon Cir Unit Lot 4
- 52 Quincy St
- 8 Dianthus Rd
Your Personal Tour Guide
Ask me questions while you tour the home.