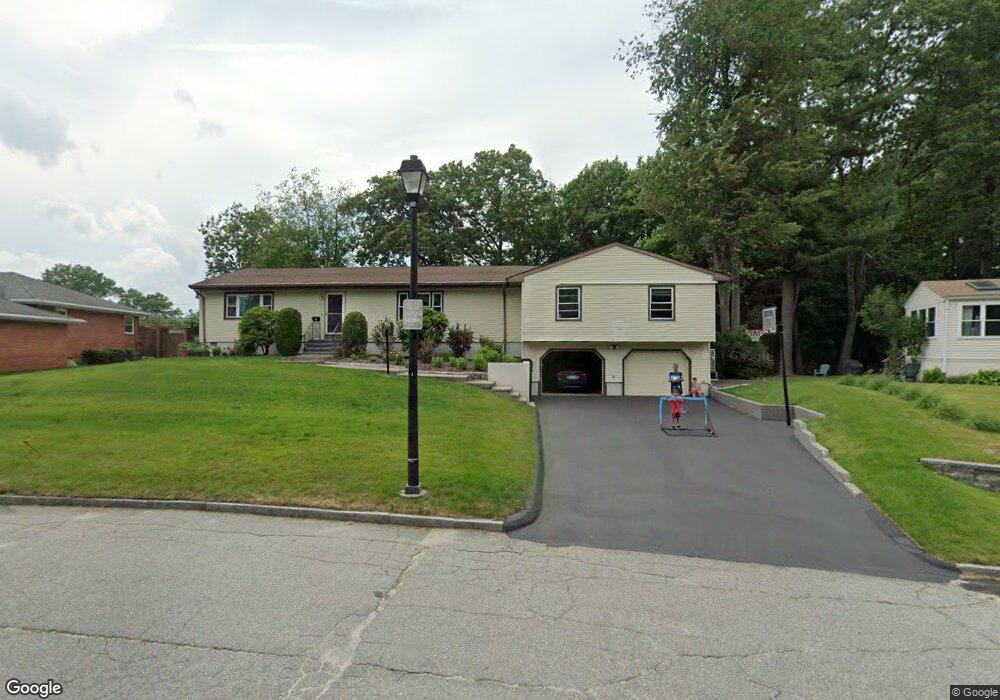
11 Claridge Dr Worcester, MA 01602
Newton Square NeighborhoodEstimated Value: $498,000 - $641,000
3
Beds
3
Baths
2,518
Sq Ft
$227/Sq Ft
Est. Value
About This Home
This home is located at 11 Claridge Dr, Worcester, MA 01602 and is currently estimated at $572,356, approximately $227 per square foot. 11 Claridge Dr is a home located in Worcester County with nearby schools including Chandler Magnet, Jacob Hiatt Magnet School, and May Street Elementary School.
Ownership History
Date
Name
Owned For
Owner Type
Purchase Details
Closed on
Aug 5, 2021
Sold by
Basil Arun K and Basil Sushma
Bought by
Arun K Basil T
Current Estimated Value
Create a Home Valuation Report for This Property
The Home Valuation Report is an in-depth analysis detailing your home's value as well as a comparison with similar homes in the area
Home Values in the Area
Average Home Value in this Area
Purchase History
| Date | Buyer | Sale Price | Title Company |
|---|---|---|---|
| Arun K Basil T | -- | None Available |
Source: Public Records
Tax History
| Year | Tax Paid | Tax Assessment Tax Assessment Total Assessment is a certain percentage of the fair market value that is determined by local assessors to be the total taxable value of land and additions on the property. | Land | Improvement |
|---|---|---|---|---|
| 2025 | $7,566 | $573,600 | $119,100 | $454,500 |
| 2024 | $7,326 | $532,800 | $119,100 | $413,700 |
| 2023 | $7,224 | $503,800 | $103,500 | $400,300 |
| 2022 | $6,443 | $423,600 | $82,800 | $340,800 |
| 2021 | $6,729 | $413,300 | $66,300 | $347,000 |
| 2020 | $6,372 | $374,800 | $66,200 | $308,600 |
| 2019 | $5,972 | $331,800 | $59,800 | $272,000 |
| 2018 | $5,705 | $301,700 | $59,800 | $241,900 |
| 2017 | $5,974 | $310,800 | $59,800 | $251,000 |
| 2016 | $6,057 | $293,900 | $44,700 | $249,200 |
| 2015 | $5,899 | $293,900 | $44,700 | $249,200 |
| 2014 | $5,737 | $293,600 | $44,700 | $248,900 |
Source: Public Records
Map
Nearby Homes
- 16 Sherwood Rd
- 32 Zenith Dr
- 19 Kenilworth Rd
- 24 Hadwen Rd
- 18 Hadwen Ln
- 47R Yarnie Unit 3A
- 47R Yarnie Unit 1B
- 47R Yarnie Unit 2B
- 47R Yarnie Unit 4B
- 47R Yarnie Unit 8B
- 47R Yarnie Unit 5A
- 47R Yarnie Unit 6B
- 47R Yarnie Unit 4A
- 47R Yarnie Unit 1A
- 47R Yarnie Unit 9
- 47R Yarnie Unit 8A
- 47R Yarnie Unit 6A
- 47R Yarnie Unit 7A
- 47R Yarnie Unit 5B
- 47R Yarnie Unit 2A
Your Personal Tour Guide
Ask me questions while you tour the home.