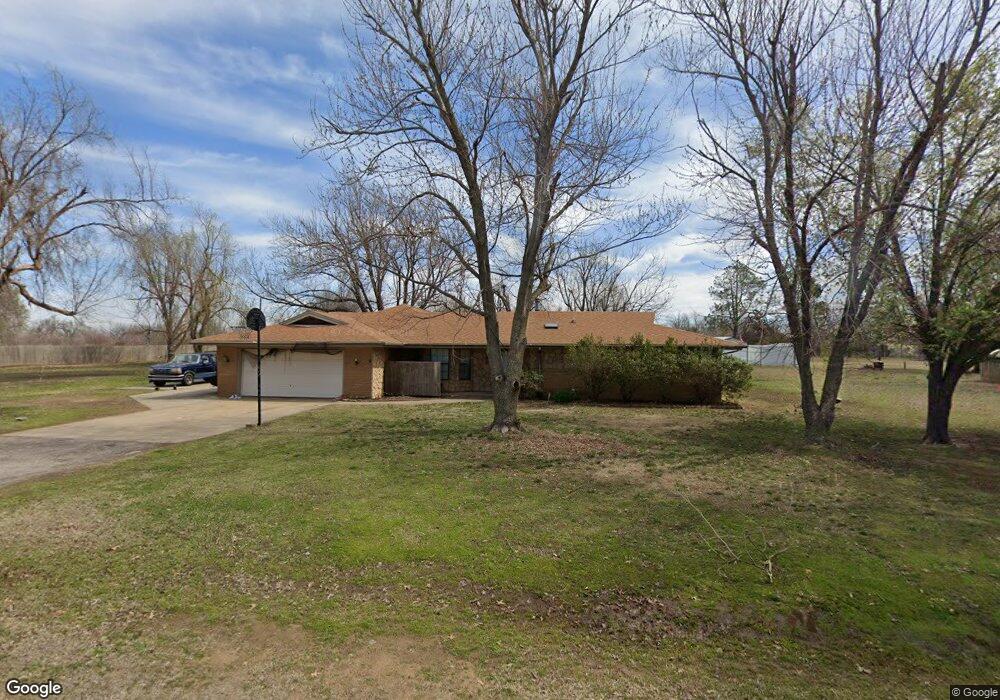
11 Clark Cir Shawnee, OK 74804
Estimated Value: $223,000 - $284,000
3
Beds
2
Baths
2,175
Sq Ft
$115/Sq Ft
Est. Value
About This Home
This home is located at 11 Clark Cir, Shawnee, OK 74804 and is currently estimated at $250,800, approximately $115 per square foot. 11 Clark Cir is a home located in Pottawatomie County with nearby schools including Dale Elementary School, Dale Middle School, and Dale High School.
Ownership History
Date
Name
Owned For
Owner Type
Purchase Details
Closed on
Oct 4, 2010
Sold by
Chaffin Janice Faye and Edwards Steven Lamar
Bought by
Edwards Steven Lamar
Current Estimated Value
Home Financials for this Owner
Home Financials are based on the most recent Mortgage that was taken out on this home.
Original Mortgage
$138,037
Outstanding Balance
$92,926
Interest Rate
4.75%
Mortgage Type
FHA
Estimated Equity
$157,874
Purchase Details
Closed on
Sep 26, 2007
Sold by
Cendant Mobility Financial Corp
Bought by
Chaffin Janice Faye and Edwards Steven Lamar
Home Financials for this Owner
Home Financials are based on the most recent Mortgage that was taken out on this home.
Original Mortgage
$136,000
Interest Rate
6.66%
Mortgage Type
Purchase Money Mortgage
Purchase Details
Closed on
Dec 26, 2000
Sold by
Dailey Hobert and Dailey Lynn
Bought by
Murray Daryl and Murray Martha
Create a Home Valuation Report for This Property
The Home Valuation Report is an in-depth analysis detailing your home's value as well as a comparison with similar homes in the area
Home Values in the Area
Average Home Value in this Area
Purchase History
| Date | Buyer | Sale Price | Title Company |
|---|---|---|---|
| Edwards Steven Lamar | -- | None Available | |
| Chaffin Janice Faye | $136,000 | Oklahoma Title & Closing Co | |
| Cendant Mobility Financial Corp | $136,000 | Oklahoma Title & Closing Co | |
| Murray Daryl | $108,000 | -- |
Source: Public Records
Mortgage History
| Date | Status | Borrower | Loan Amount |
|---|---|---|---|
| Open | Edwards Steven Lamar | $138,037 | |
| Closed | Chaffin Janice Faye | $136,000 |
Source: Public Records
Tax History Compared to Growth
Tax History
| Year | Tax Paid | Tax Assessment Tax Assessment Total Assessment is a certain percentage of the fair market value that is determined by local assessors to be the total taxable value of land and additions on the property. | Land | Improvement |
|---|---|---|---|---|
| 2024 | $1,333 | $12,765 | $960 | $11,805 |
| 2023 | $1,333 | $12,765 | $960 | $11,805 |
| 2022 | $1,208 | $12,765 | $960 | $11,805 |
| 2021 | $1,326 | $12,765 | $960 | $11,805 |
| 2020 | $1,356 | $13,039 | $960 | $12,079 |
| 2019 | $1,473 | $13,586 | $960 | $12,626 |
| 2018 | $1,478 | $13,767 | $960 | $12,807 |
| 2017 | $1,444 | $13,929 | $960 | $12,969 |
| 2016 | $1,225 | $13,523 | $960 | $12,563 |
| 2015 | $1,213 | $13,130 | $960 | $12,170 |
| 2014 | $1,213 | $13,285 | $960 | $12,325 |
Source: Public Records
Map
Nearby Homes
- 15 Gaddy Rd
- 12803 Gaddy Rd
- 120 Acres Hwy 140 & Hwy 177 Rd
- 5557 Coker Rd
- 13804 Coker Rd
- 2666 Legacy Place
- 70 Kristen Ct
- 121 Lake Shore Dr
- 129 Lake Shore Dr
- 38604 Collina Dr
- 36236 Prairie Ridge Ct
- 00 Gaddy Lot 2 Rd
- 36021 Prairie Rdg Rd
- 35502 Pecan Grove Rd
- 35407 Westech Rd
- 37614 W Macarthur St
- 36656 Garrett's Lake Rd
- 14955 White Oak Ln
- 1933 Rain Tree Dr
- 1914 Oak Tree Ct