
Seller's Agent in 2015
Ben Faubert
Onshore Realtors
(401) 315-2588
107 in this area
115 Total Sales
Estimated Value: $479,000 - $592,000
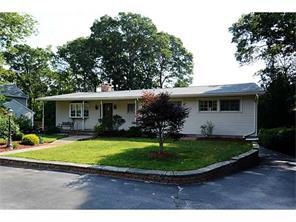
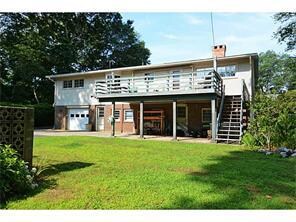
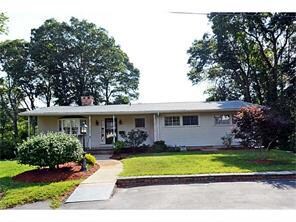
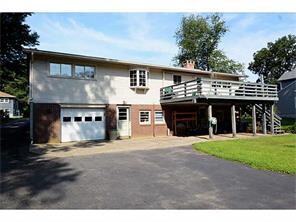
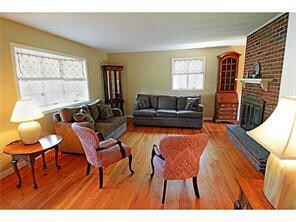
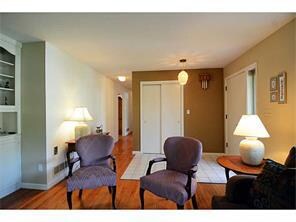
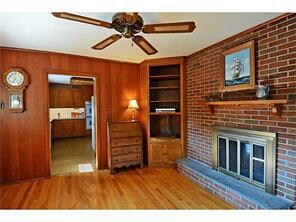
This home is located at 11 Clay Ln, Westerly, RI 02891 since 07 August 2015 and is currently estimated at $545,851, approximately $268 per square foot. This property was built in 1973. 11 Clay Ln is a home located in Washington County with nearby schools including Westerly High School and St. Michael School.
Last Agent to Sell the Property
Onshore Realtors License #REC.0017150 Listed on: 08/07/2015
| Date | Buyer | Sale Price | Title Company |
|---|---|---|---|
| Steeves Dennis W | $255,000 | -- |
| Date | Event | Price | List to Sale | Price per Sq Ft |
|---|---|---|---|---|
| 10/01/2015 10/01/15 | Sold | $255,000 | -3.8% | $125 / Sq Ft |
| 09/01/2015 09/01/15 | Pending | -- | -- | -- |
| 08/07/2015 08/07/15 | For Sale | $265,000 | -- | $130 / Sq Ft |
| Year | Tax Paid | Tax Assessment Tax Assessment Total Assessment is a certain percentage of the fair market value that is determined by local assessors to be the total taxable value of land and additions on the property. | Land | Improvement |
|---|---|---|---|---|
| 2025 | $3,555 | $456,900 | $170,600 | $286,300 |
| 2024 | $3,466 | $331,700 | $121,900 | $209,800 |
| 2023 | $3,370 | $331,700 | $121,900 | $209,800 |
| 2022 | $3,350 | $331,700 | $121,900 | $209,800 |
| 2021 | $3,251 | $269,600 | $106,000 | $163,600 |
| 2020 | $3,195 | $269,600 | $106,000 | $163,600 |
| 2019 | $3,165 | $269,600 | $106,000 | $163,600 |
| 2018 | $3,071 | $248,700 | $106,000 | $142,700 |
| 2017 | $2,984 | $248,700 | $106,000 | $142,700 |
| 2016 | $2,984 | $248,700 | $106,000 | $142,700 |
| 2015 | $2,696 | $240,100 | $108,200 | $131,900 |
| 2014 | $2,653 | $240,100 | $108,200 | $131,900 |
Seller's Agent in 2015
Ben Faubert
Onshore Realtors
(401) 315-2588
107 in this area
115 Total Sales
Source: State-Wide MLS
MLS Number: 1104571
APN: WEST-000078-000058
Disclaimer: Certain information contained herein is derived from information provided by parties other than Homes.com. All information provided is deemed reliable, but is not guaranteed to be accurate and should be independently verified.
![]() IDX information is provided exclusively for personal, non-commercial use, and may not be used for any purpose other than to identify prospective properties consumers may be interested in purchasing. Information is deemed reliable but not guaranteed.
IDX information is provided exclusively for personal, non-commercial use, and may not be used for any purpose other than to identify prospective properties consumers may be interested in purchasing. Information is deemed reliable but not guaranteed.
Copyright © 2025 State-Wide MLS, Inc. All rights reserved.