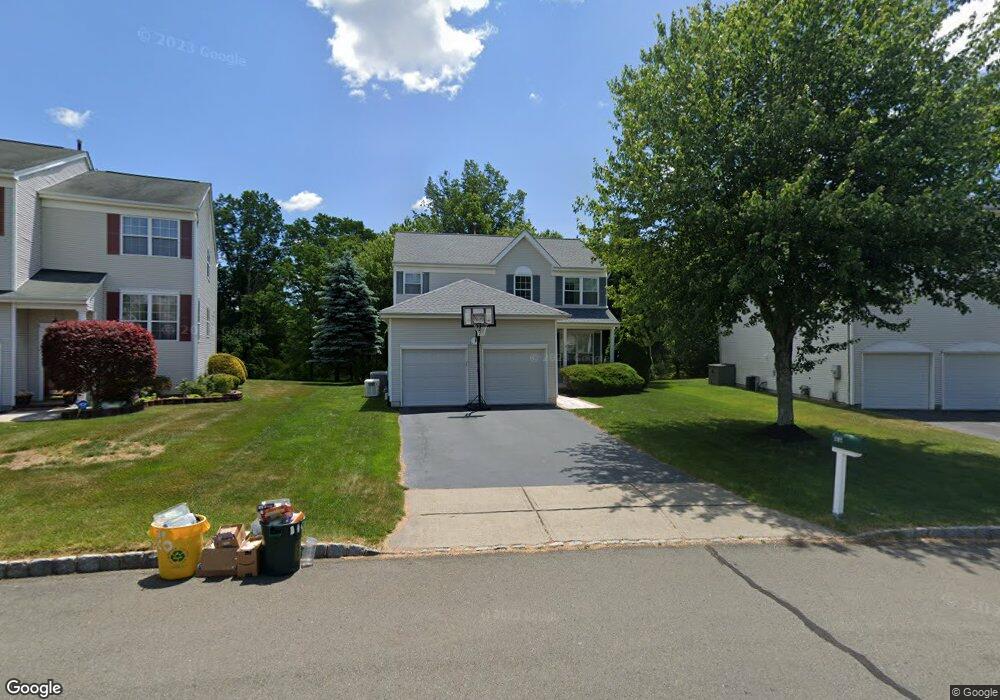
11 Coburn Rd Pennington, NJ 08534
Estimated Value: $779,863 - $840,000
Studio
--
Bath
2,052
Sq Ft
$395/Sq Ft
Est. Value
About This Home
This home is located at 11 Coburn Rd, Pennington, NJ 08534 and is currently estimated at $811,466, approximately $395 per square foot. 11 Coburn Rd is a home located in Mercer County with nearby schools including Hopewell Valley Central High School, Guidepost Montessori at Lawrenceville, and Saint Ann School.
Ownership History
Date
Name
Owned For
Owner Type
Purchase Details
Closed on
Jul 13, 2005
Sold by
Curlis Estates Llc
Bought by
Polverejan Mihai and Polverejan Elena
Current Estimated Value
Home Financials for this Owner
Home Financials are based on the most recent Mortgage that was taken out on this home.
Original Mortgage
$416,000
Interest Rate
5.84%
Purchase Details
Closed on
May 14, 1999
Sold by
Shah Rupesh
Bought by
Curlis Estates Llc
Purchase Details
Closed on
Jul 29, 1997
Sold by
Hopewell K Hovnanian
Bought by
Shah Rupeshcid and Chaillj Moira
Home Financials for this Owner
Home Financials are based on the most recent Mortgage that was taken out on this home.
Original Mortgage
$174,000
Interest Rate
7.46%
Create a Home Valuation Report for This Property
The Home Valuation Report is an in-depth analysis detailing your home's value as well as a comparison with similar homes in the area
Home Values in the Area
Average Home Value in this Area
Purchase History
| Date | Buyer | Sale Price | Title Company |
|---|---|---|---|
| Polverejan Mihai | $520,000 | -- | |
| Curlis Estates Llc | $233,770 | -- | |
| Shah Rupeshcid | $217,968 | -- |
Source: Public Records
Mortgage History
| Date | Status | Borrower | Loan Amount |
|---|---|---|---|
| Previous Owner | Polverejan Mihai | $416,000 | |
| Previous Owner | Shah Rupeshcid | $174,000 |
Source: Public Records
Tax History
| Year | Tax Paid | Tax Assessment Tax Assessment Total Assessment is a certain percentage of the fair market value that is determined by local assessors to be the total taxable value of land and additions on the property. | Land | Improvement |
|---|---|---|---|---|
| 2025 | $14,427 | $457,000 | $192,100 | $264,900 |
| 2024 | $13,556 | $457,000 | $192,100 | $264,900 |
| 2023 | $13,556 | $443,600 | $178,700 | $264,900 |
| 2022 | $13,277 | $443,600 | $178,700 | $264,900 |
| 2021 | $13,181 | $430,900 | $166,000 | $264,900 |
| 2020 | $12,862 | $430,900 | $166,000 | $264,900 |
| 2019 | $12,548 | $430,900 | $166,000 | $264,900 |
| 2018 | $12,315 | $430,900 | $166,000 | $264,900 |
| 2017 | $11,979 | $430,900 | $166,000 | $264,900 |
| 2016 | $11,040 | $420,100 | $166,000 | $254,100 |
| 2015 | $11,154 | $420,100 | $166,000 | $254,100 |
| 2014 | $10,923 | $420,100 | $166,000 | $254,100 |
Source: Public Records
Map
Nearby Homes
- 27 Donovan Rd
- 4 Santina Ct
- 112 Treymore Ct
- 9 Shirley Ln
- 305 Deer Run Ct Unit C
- 305 Tuxford Ct
- 200 Amberleigh Dr Unit 32H
- 6 Allura Ct
- 246 Brinley Dr Unit 94
- 3 Ventana Ct
- 28 Sutton Ct
- 10 Featherbed Ct
- 41 Lawrencia Dr
- 10 Howe Ct
- 100 Denow Rd
- 15 Coral Tree Ct
- 36 Viburnum Ct
- 32 Traditions Way
- 14 Azalea Ct
- 163 Federal Point Blvd
Your Personal Tour Guide
Ask me questions while you tour the home.