N
Seller's Agent in 2023
Non Member
Non Member Office

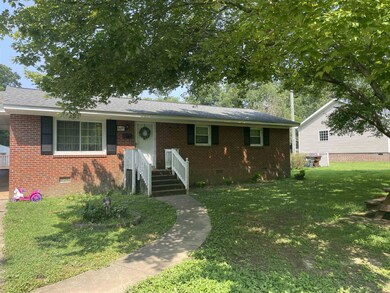
Estimated Value: $200,000 - $246,418
Private sale within family. Not sold at market value. Entered for comp purposes.
Last Agent to Sell the Property
Non Member
Non Member Office Listed on: 06/28/2023
We collect this data history from publicly available records. To have your information removed, we recommend requesting removal directly through your county’s website.
We collect this data history from publicly available records. To have your information removed, we recommend requesting removal directly through your county’s website.
| Date | Buyer | Sale Price | Title Company |
|---|---|---|---|
| -- | None Listed On Document | ||
| $210,000 | None Listed On Document |
We collect this data history from publicly available records. To have your information removed, we recommend requesting removal directly through your county’s website.
| Date | Status | Borrower | Loan Amount |
|---|---|---|---|
| Open | $168,000 |
We collect this data history from publicly available records. To have your information removed, we recommend requesting removal directly through your county’s website.
| Date | Event | Price | List to Sale | Price per Sq Ft |
|---|---|---|---|---|
| 12/18/2023 12/18/23 | Off Market | $210,000 | -- | -- |
| 07/18/2023 07/18/23 | Sold | $210,000 | 0.0% | $181 / Sq Ft |
| 06/28/2023 06/28/23 | Pending | -- | -- | -- |
| 06/28/2023 06/28/23 | For Sale | $210,000 | -- | $181 / Sq Ft |
We collect this data history from publicly available records. To have your information removed, we recommend requesting removal directly through your county’s website.
| Year | Tax Paid | Tax Assessment Tax Assessment Total Assessment is a certain percentage of the fair market value that is determined by local assessors to be the total taxable value of land and additions on the property. | Land | Improvement |
|---|---|---|---|---|
| 2025 | $3,109 | $234,260 | $66,650 | $167,610 |
| 2024 | $3,144 | $234,260 | $66,650 | $167,610 |
| 2023 | $1,888 | $103,820 | $18,940 | $84,880 |
| 2022 | $1,867 | $103,820 | $18,940 | $84,880 |
| 2021 | $1,766 | $103,820 | $18,940 | $84,880 |
| 2020 | $1,893 | $103,820 | $18,940 | $84,880 |
| 2019 | $1,886 | $103,820 | $18,940 | $84,880 |
| 2018 | $1,927 | $103,820 | $18,940 | $84,880 |
| 2017 | $1,720 | $84,980 | $18,940 | $66,040 |
| 2016 | $1,867 | $91,830 | $18,940 | $72,890 |
| 2015 | $1,943 | $91,830 | $18,940 | $72,890 |
| 2014 | $1,833 | $91,830 | $18,940 | $72,890 |
N
Seller's Agent in 2023
Non Member
Non Member Office

Buyer's Agent in 2023
Monica Foley
Foley Properties & Estates Co.
(919) 616-9891
2 in this area
64 Total Sales
Source: Doorify MLS
MLS Number: 2523713
APN: 008083
Disclaimer: Certain information contained herein is derived from information provided by parties other than Homes.com. All information provided is deemed reliable, but is not guaranteed to be accurate and should be independently verified.
![]() Some IDX listings have been excluded from this IDX display. Brokers make an effort to deliver accurate information, but buyers should independently verify any information on which they will rely in a transaction. The listing broker shall not be responsible for any typographical errors, misinformation, or misprints, and they shall be held totally harmless from any damages arising from reliance upon this data. This data is provided exclusively for consumers’ personal, non-commercial use. Listings marked with an icon are provided courtesy of the Doorify MLS, Inc. of North Carolina, Internet Data Exchange Database. Closed (sold) listings may have been listed and/or sold by a real estate firm other than the firm(s) featured on this website. Closed data is not available until the sale of the property is recorded in the MLS. Home sale data is not an appraisal, CMA, competitive or comparative market analysis, or home valuation of any property. Copyright 2026 Doorify MLS, Inc. of North Carolina. All rights reserved.
Some IDX listings have been excluded from this IDX display. Brokers make an effort to deliver accurate information, but buyers should independently verify any information on which they will rely in a transaction. The listing broker shall not be responsible for any typographical errors, misinformation, or misprints, and they shall be held totally harmless from any damages arising from reliance upon this data. This data is provided exclusively for consumers’ personal, non-commercial use. Listings marked with an icon are provided courtesy of the Doorify MLS, Inc. of North Carolina, Internet Data Exchange Database. Closed (sold) listings may have been listed and/or sold by a real estate firm other than the firm(s) featured on this website. Closed data is not available until the sale of the property is recorded in the MLS. Home sale data is not an appraisal, CMA, competitive or comparative market analysis, or home valuation of any property. Copyright 2026 Doorify MLS, Inc. of North Carolina. All rights reserved.
Ask me questions while you tour the home.