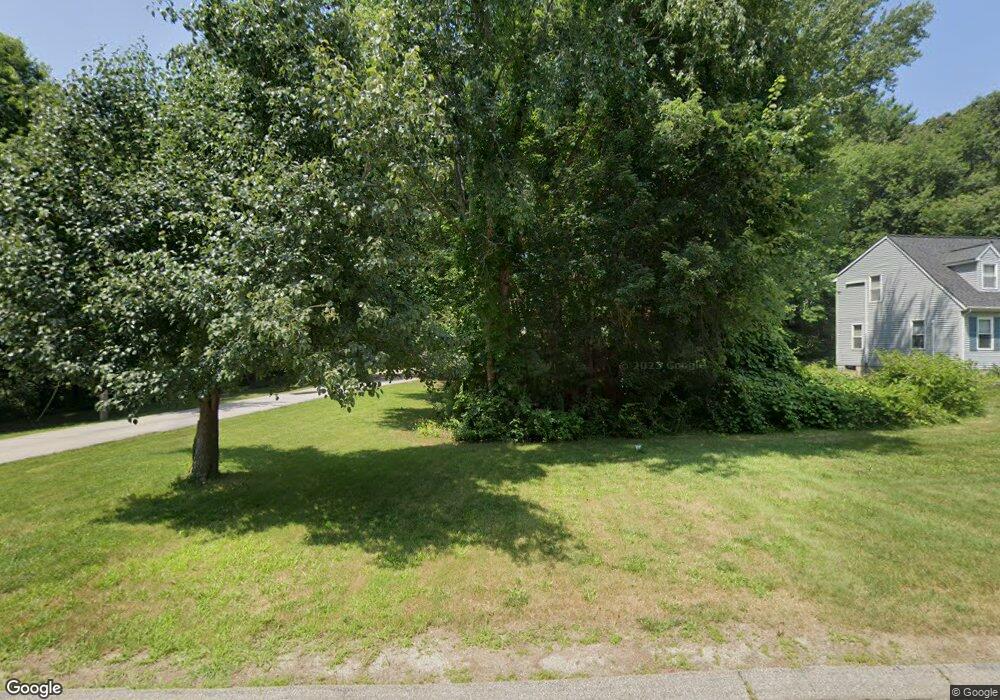
11 Colonial Rd Douglas, MA 01516
Estimated Value: $518,000 - $547,000
3
Beds
2
Baths
1,800
Sq Ft
$295/Sq Ft
Est. Value
About This Home
This home is located at 11 Colonial Rd, Douglas, MA 01516 and is currently estimated at $530,769, approximately $294 per square foot. 11 Colonial Rd is a home located in Worcester County with nearby schools including Douglas Primary School, Douglas Middle School, and Douglas High School.
Ownership History
Date
Name
Owned For
Owner Type
Purchase Details
Closed on
Sep 5, 2006
Sold by
Roche James P
Bought by
Nunez Ana G
Current Estimated Value
Home Financials for this Owner
Home Financials are based on the most recent Mortgage that was taken out on this home.
Original Mortgage
$215,000
Outstanding Balance
$130,238
Interest Rate
6.83%
Mortgage Type
Purchase Money Mortgage
Estimated Equity
$400,531
Purchase Details
Closed on
Aug 23, 2001
Sold by
Murphy John E and Murphy Valerie
Bought by
Roche Pamela and Roche James
Purchase Details
Closed on
Feb 9, 2000
Sold by
Mulcahy Leo B and Mulcahy Mary L
Bought by
Murphy John E and Murphy Valerie
Purchase Details
Closed on
May 19, 1999
Sold by
Lorion Barry J
Bought by
Mulcahy Leo B and Mulcahy Mary L
Purchase Details
Closed on
Sep 18, 1995
Sold by
Kentco Dev Inc
Bought by
Lorion Barry J
Create a Home Valuation Report for This Property
The Home Valuation Report is an in-depth analysis detailing your home's value as well as a comparison with similar homes in the area
Home Values in the Area
Average Home Value in this Area
Purchase History
| Date | Buyer | Sale Price | Title Company |
|---|---|---|---|
| Nunez Ana G | $295,000 | -- | |
| Roche Pamela | $205,000 | -- | |
| Murphy John E | $162,000 | -- | |
| Mulcahy Leo B | $146,200 | -- | |
| Lorion Barry J | $118,000 | -- |
Source: Public Records
Mortgage History
| Date | Status | Borrower | Loan Amount |
|---|---|---|---|
| Open | Nunez Ana G | $215,000 | |
| Previous Owner | Lorion Barry J | $209,500 | |
| Previous Owner | Lorion Barry J | $206,500 |
Source: Public Records
Tax History
| Year | Tax Paid | Tax Assessment Tax Assessment Total Assessment is a certain percentage of the fair market value that is determined by local assessors to be the total taxable value of land and additions on the property. | Land | Improvement |
|---|---|---|---|---|
| 2025 | $56 | $425,900 | $115,600 | $310,300 |
| 2024 | $5,490 | $406,100 | $105,100 | $301,000 |
| 2023 | $5,428 | $378,000 | $105,100 | $272,900 |
| 2022 | $5,206 | $318,600 | $87,000 | $231,600 |
| 2021 | $4,951 | $296,100 | $82,800 | $213,300 |
| 2020 | $4,849 | $285,600 | $82,800 | $202,800 |
| 2019 | $4,769 | $272,500 | $82,800 | $189,700 |
| 2018 | $4,260 | $265,100 | $82,800 | $182,300 |
| 2017 | $4,045 | $241,900 | $80,300 | $161,600 |
| 2016 | $3,941 | $234,300 | $80,300 | $154,000 |
| 2015 | $3,857 | $234,300 | $80,300 | $154,000 |
Source: Public Records
Map
Nearby Homes
Your Personal Tour Guide
Ask me questions while you tour the home.